Tactileview Design Challenge
2018, New York, US
Instructor
Regine Gilbert
My Role
Research, Tutorial Content Production, Interaction
Team
Freda Liang, Rashid Aziz, Ranti Randeniyi
Development Tools
HTML
Timeline 4 weeks
Regine Gilbert
My Role
Research, Tutorial Content Production, Interaction
Team
Freda Liang, Rashid Aziz, Ranti Randeniyi
Development Tools
HTML
Timeline 4 weeks
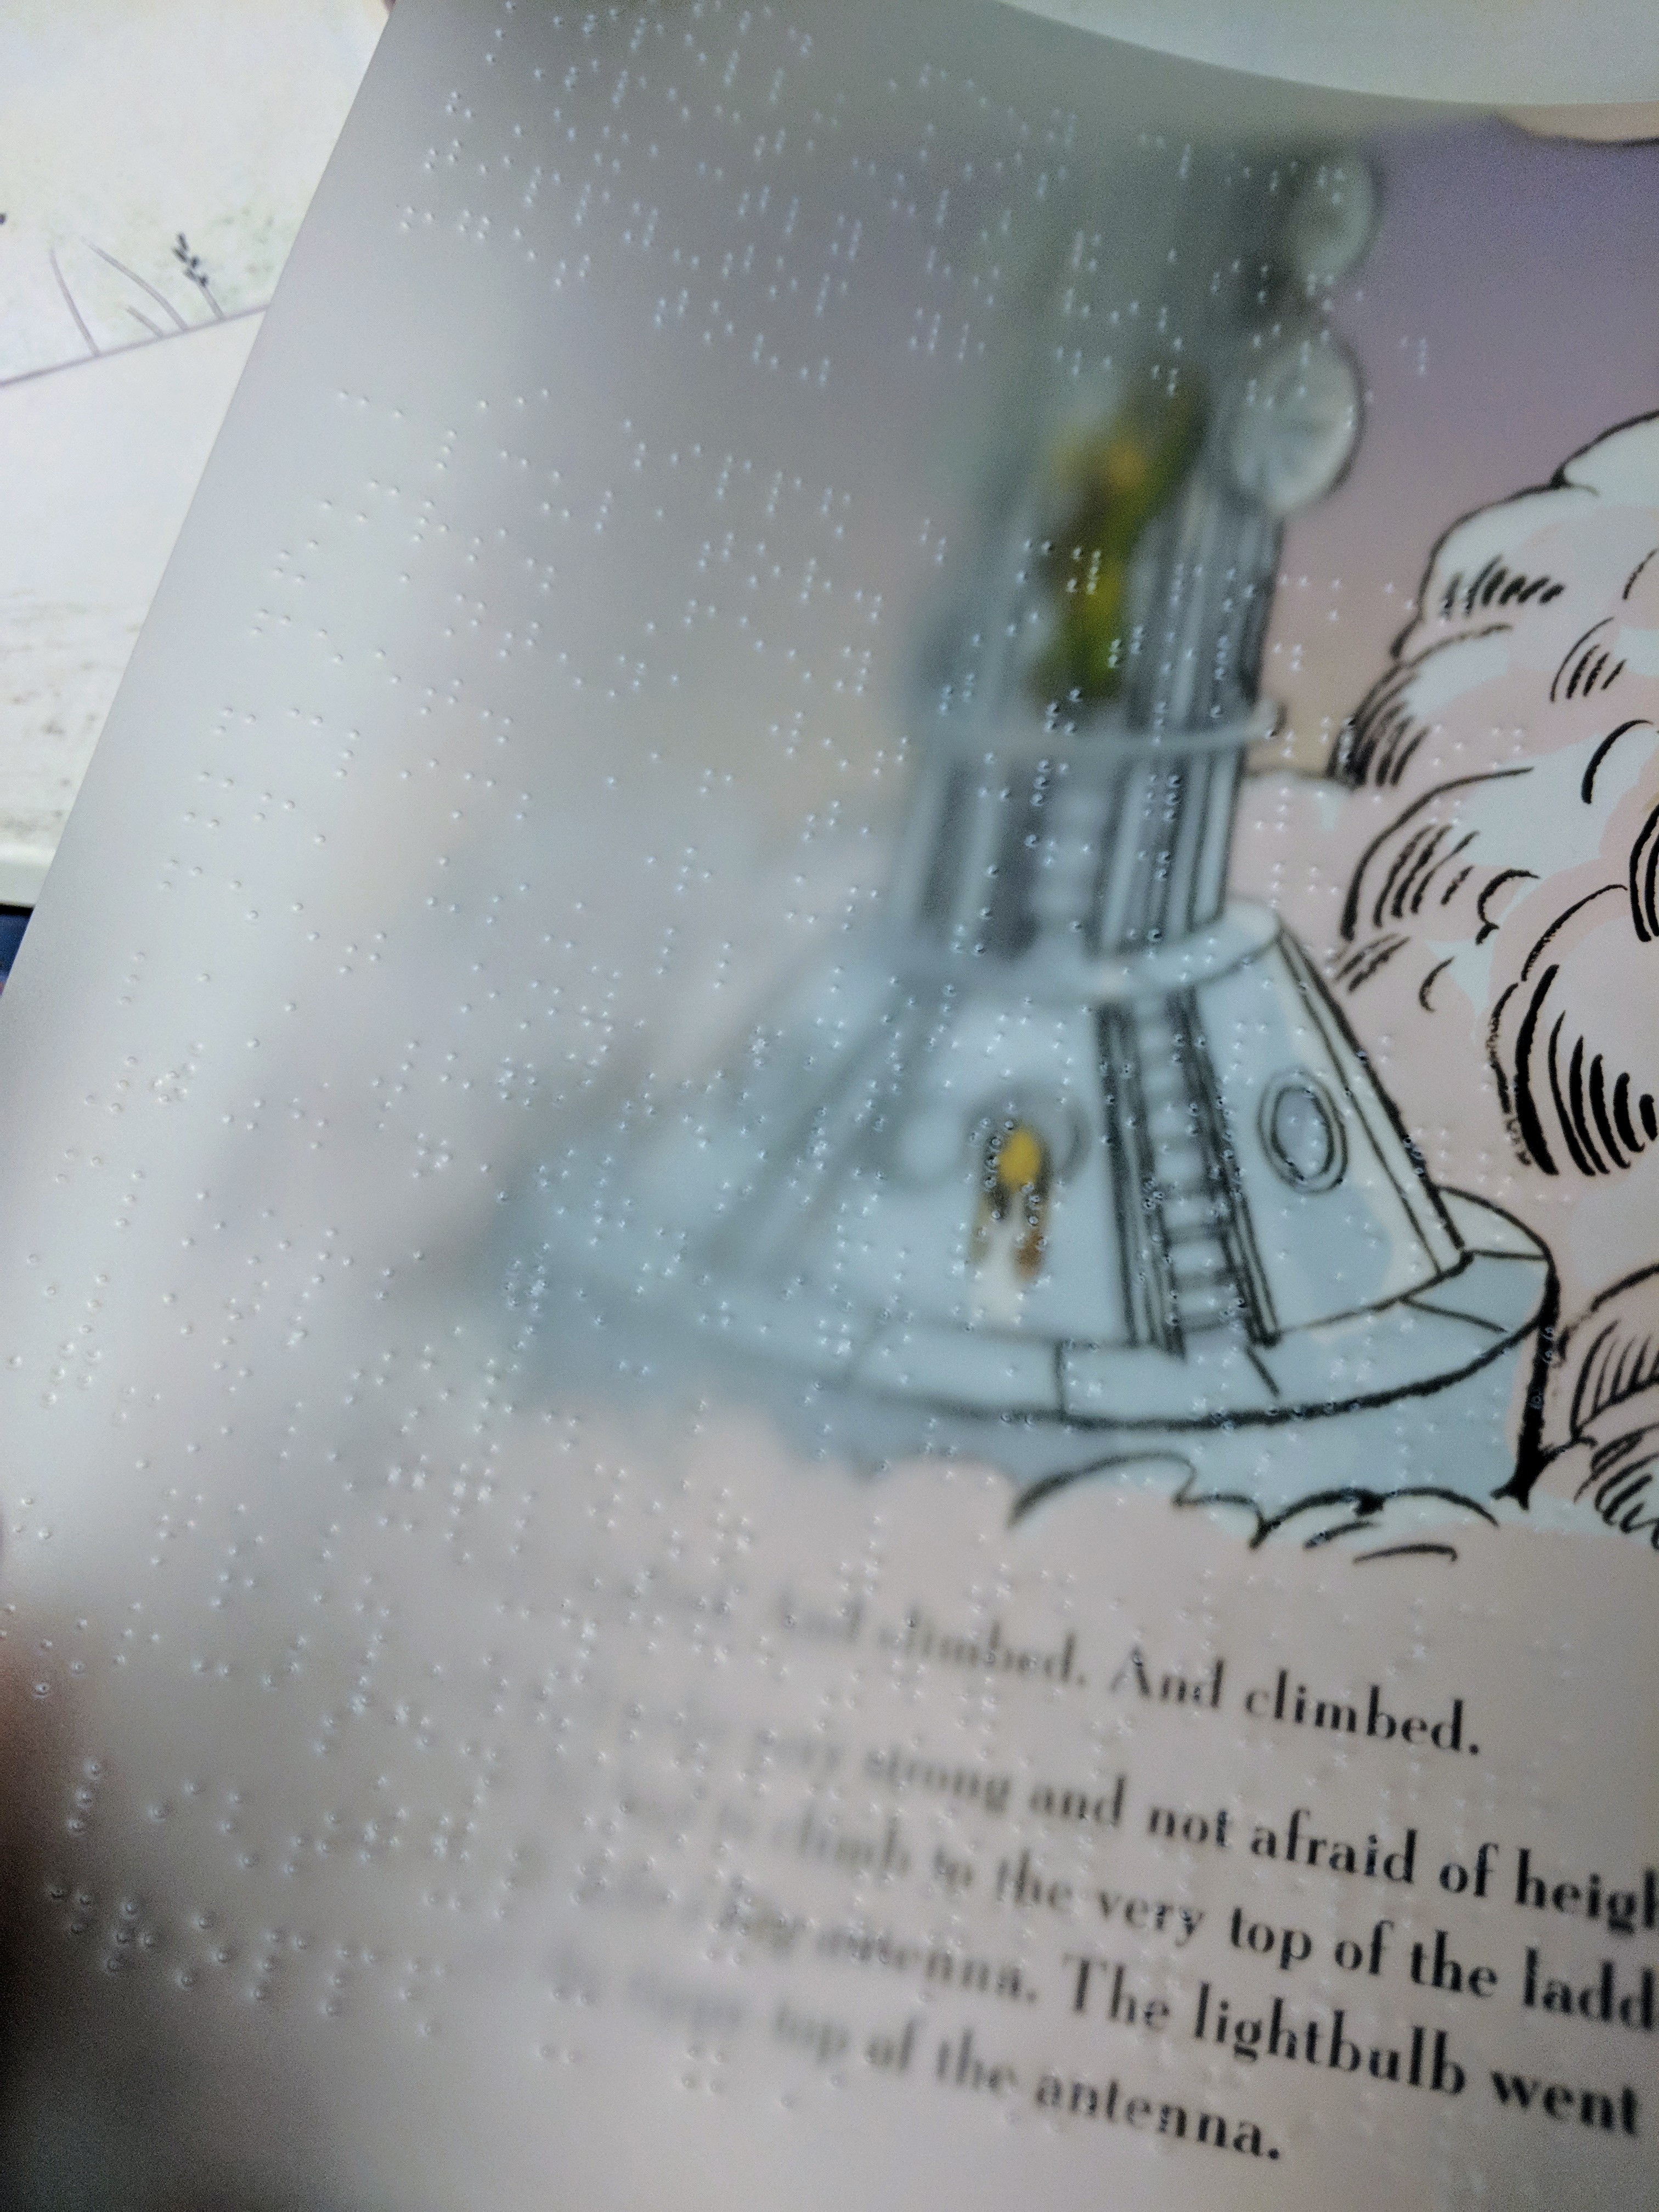
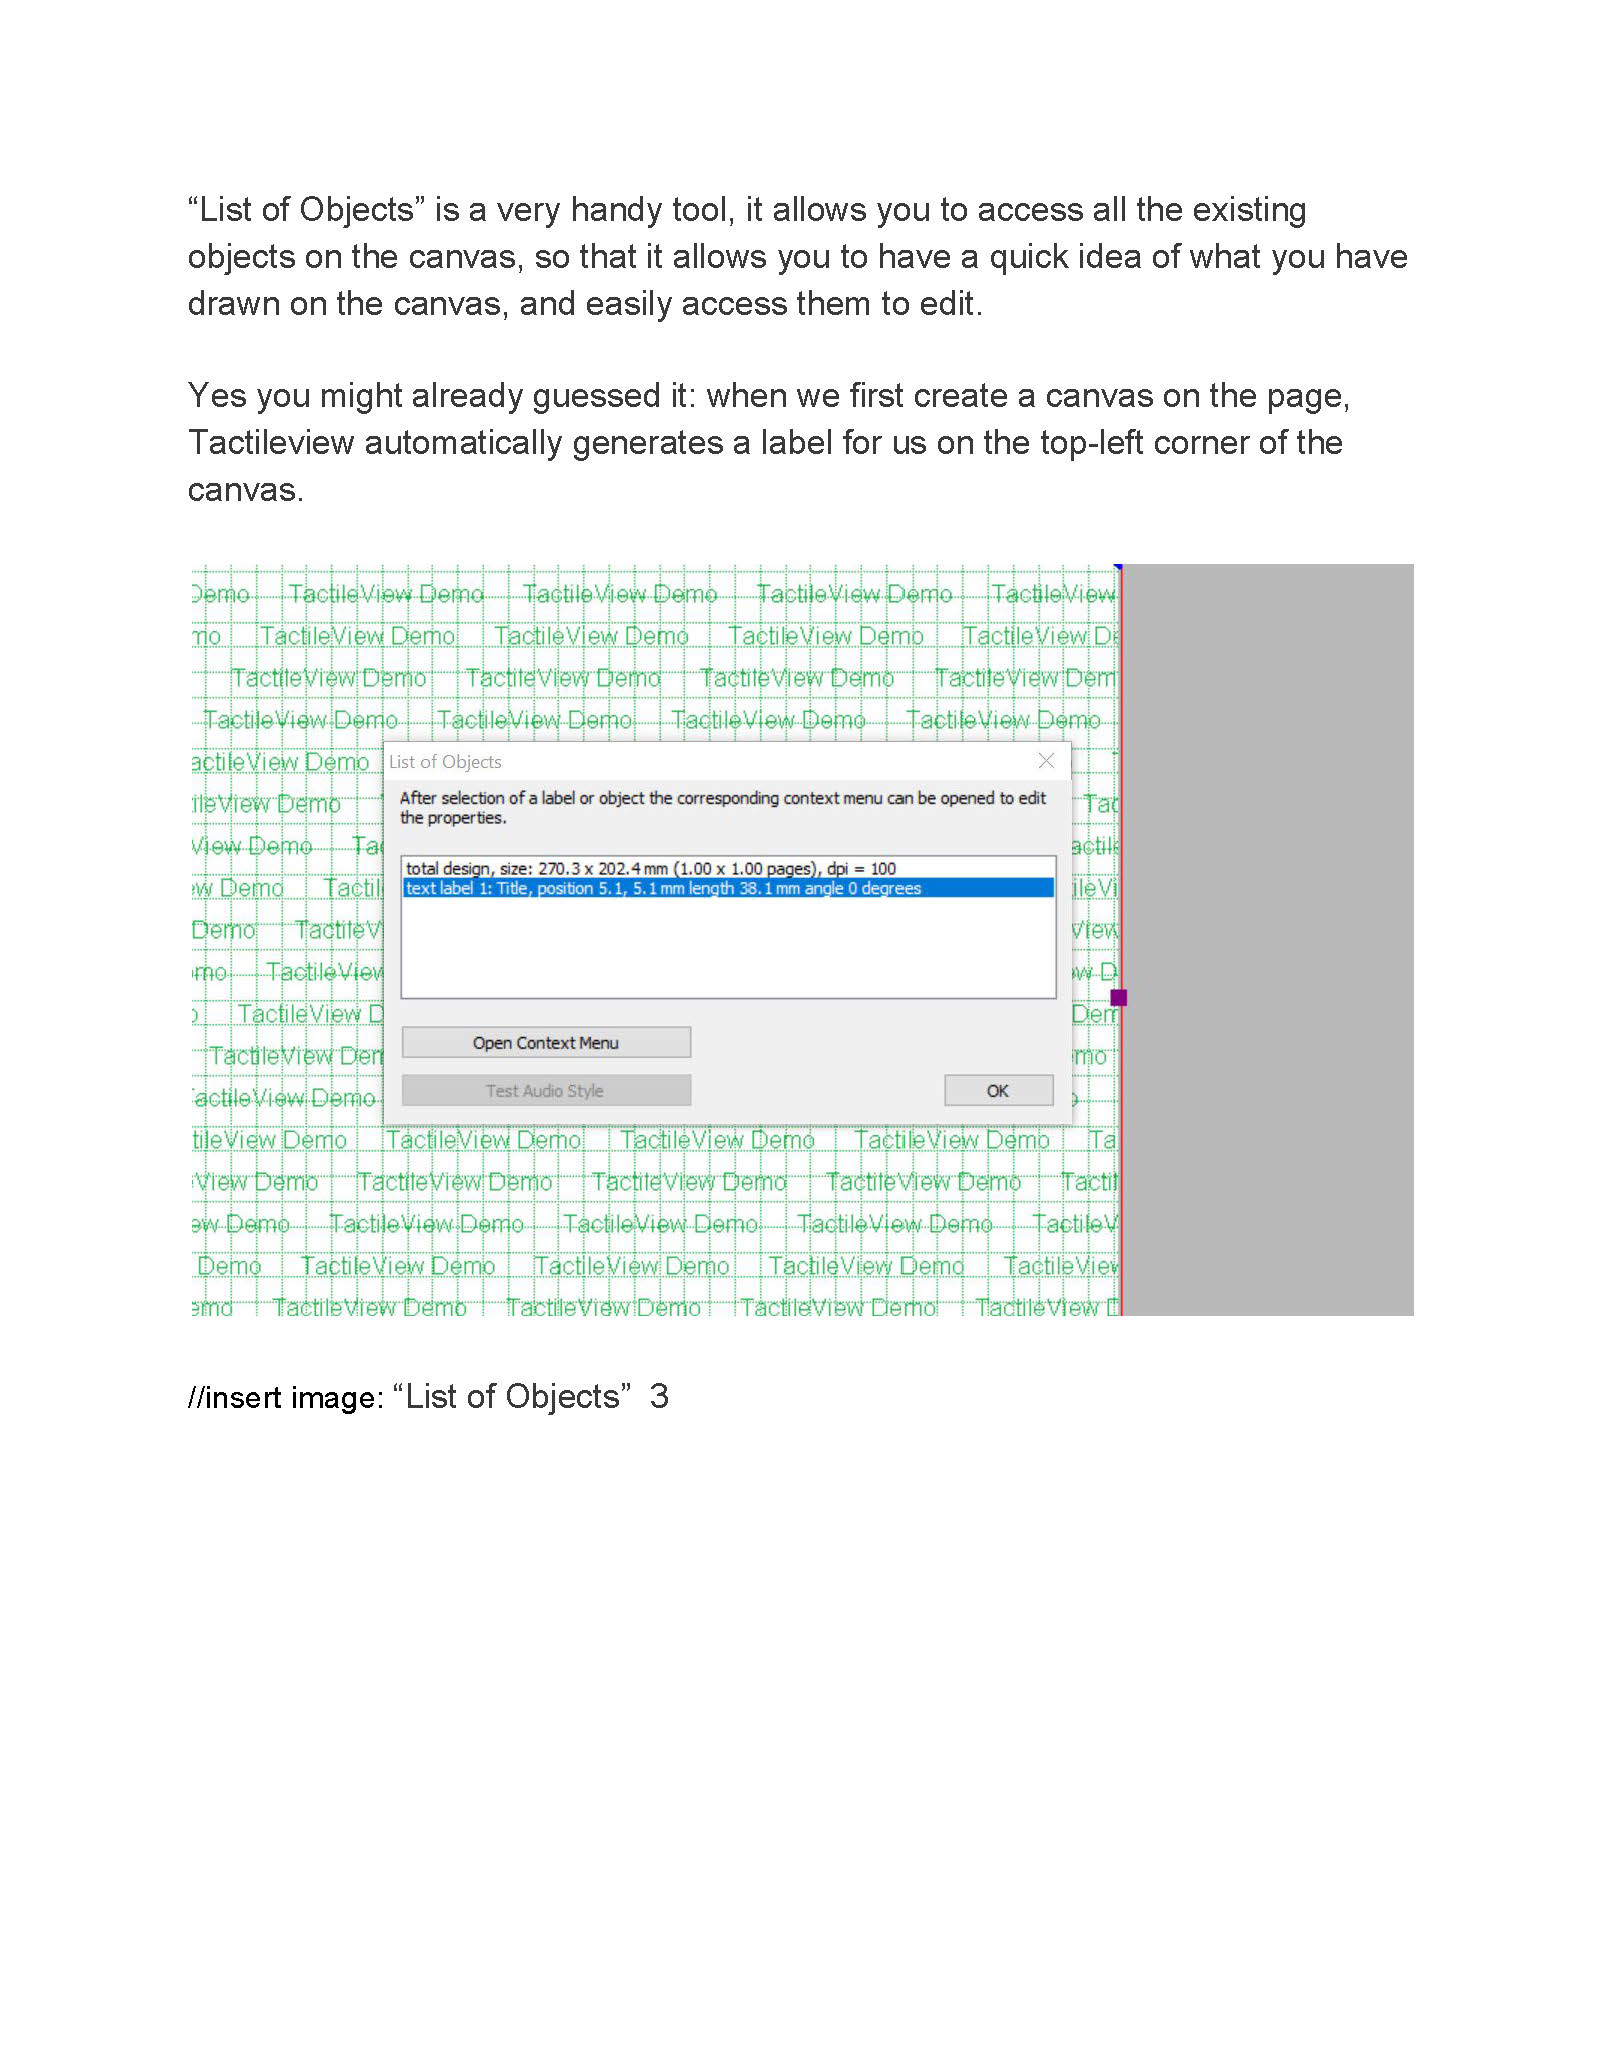
Accessibility research and design that helps low-vision population read tactile graphics
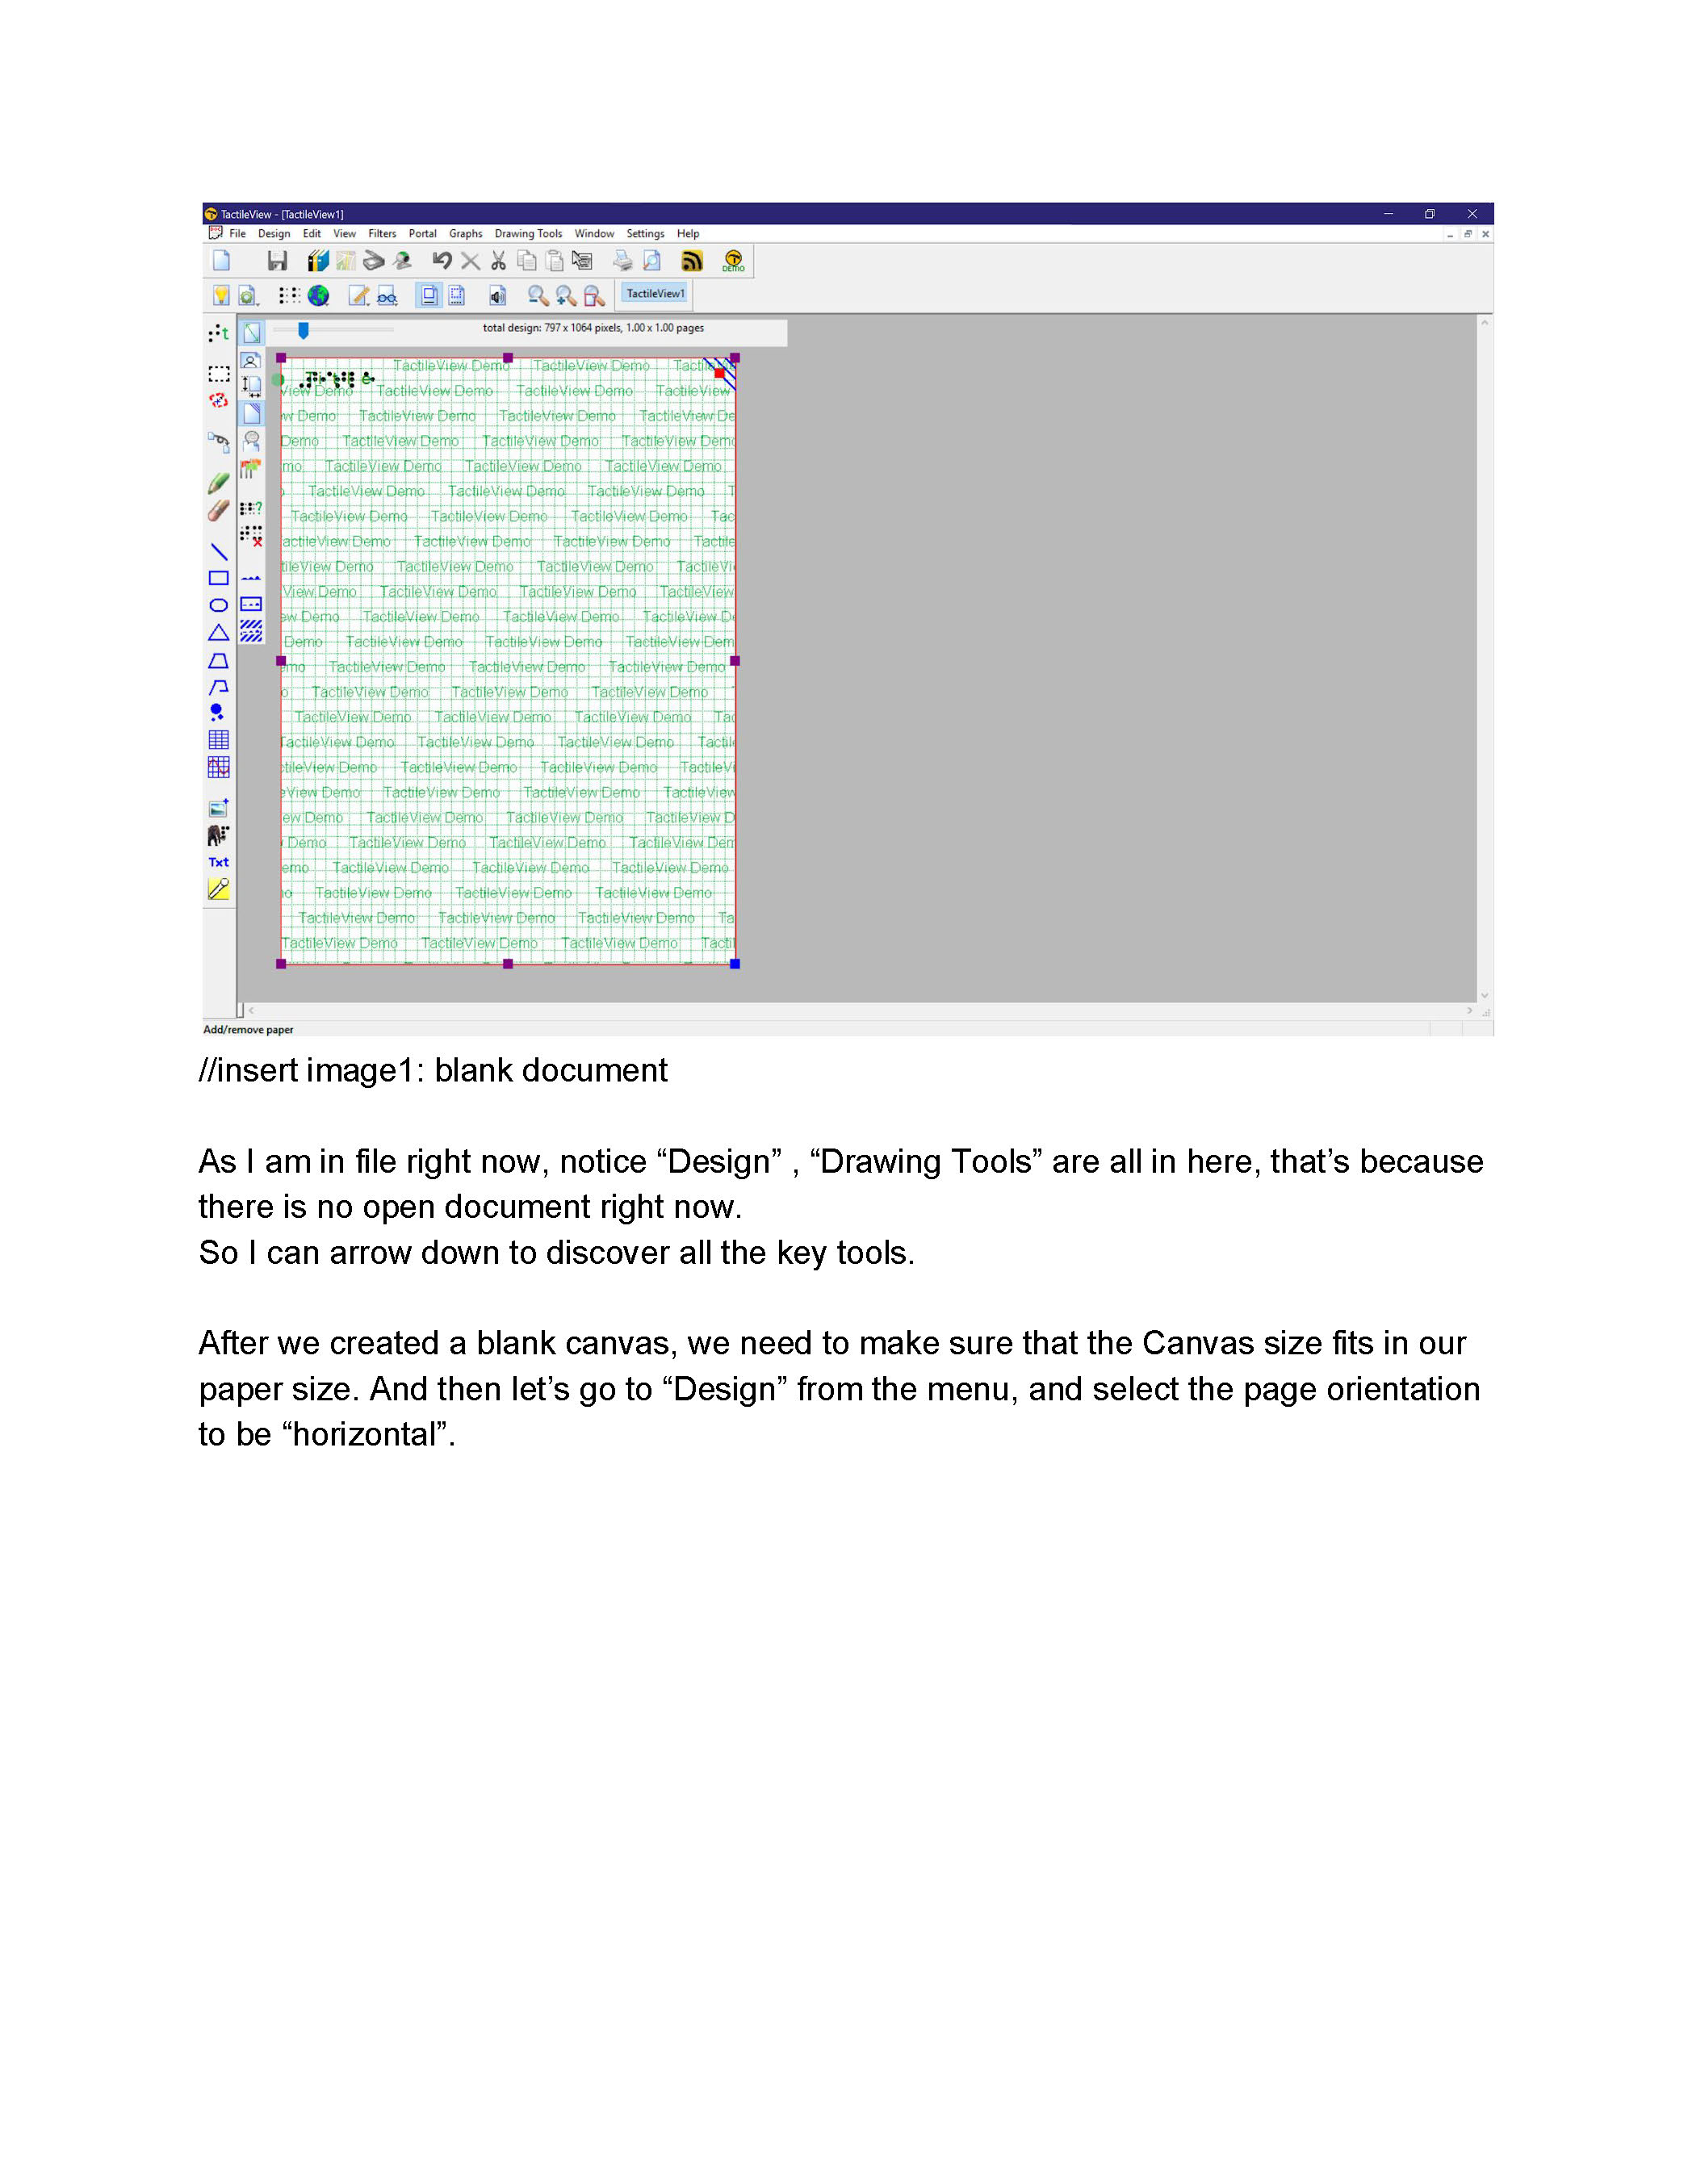
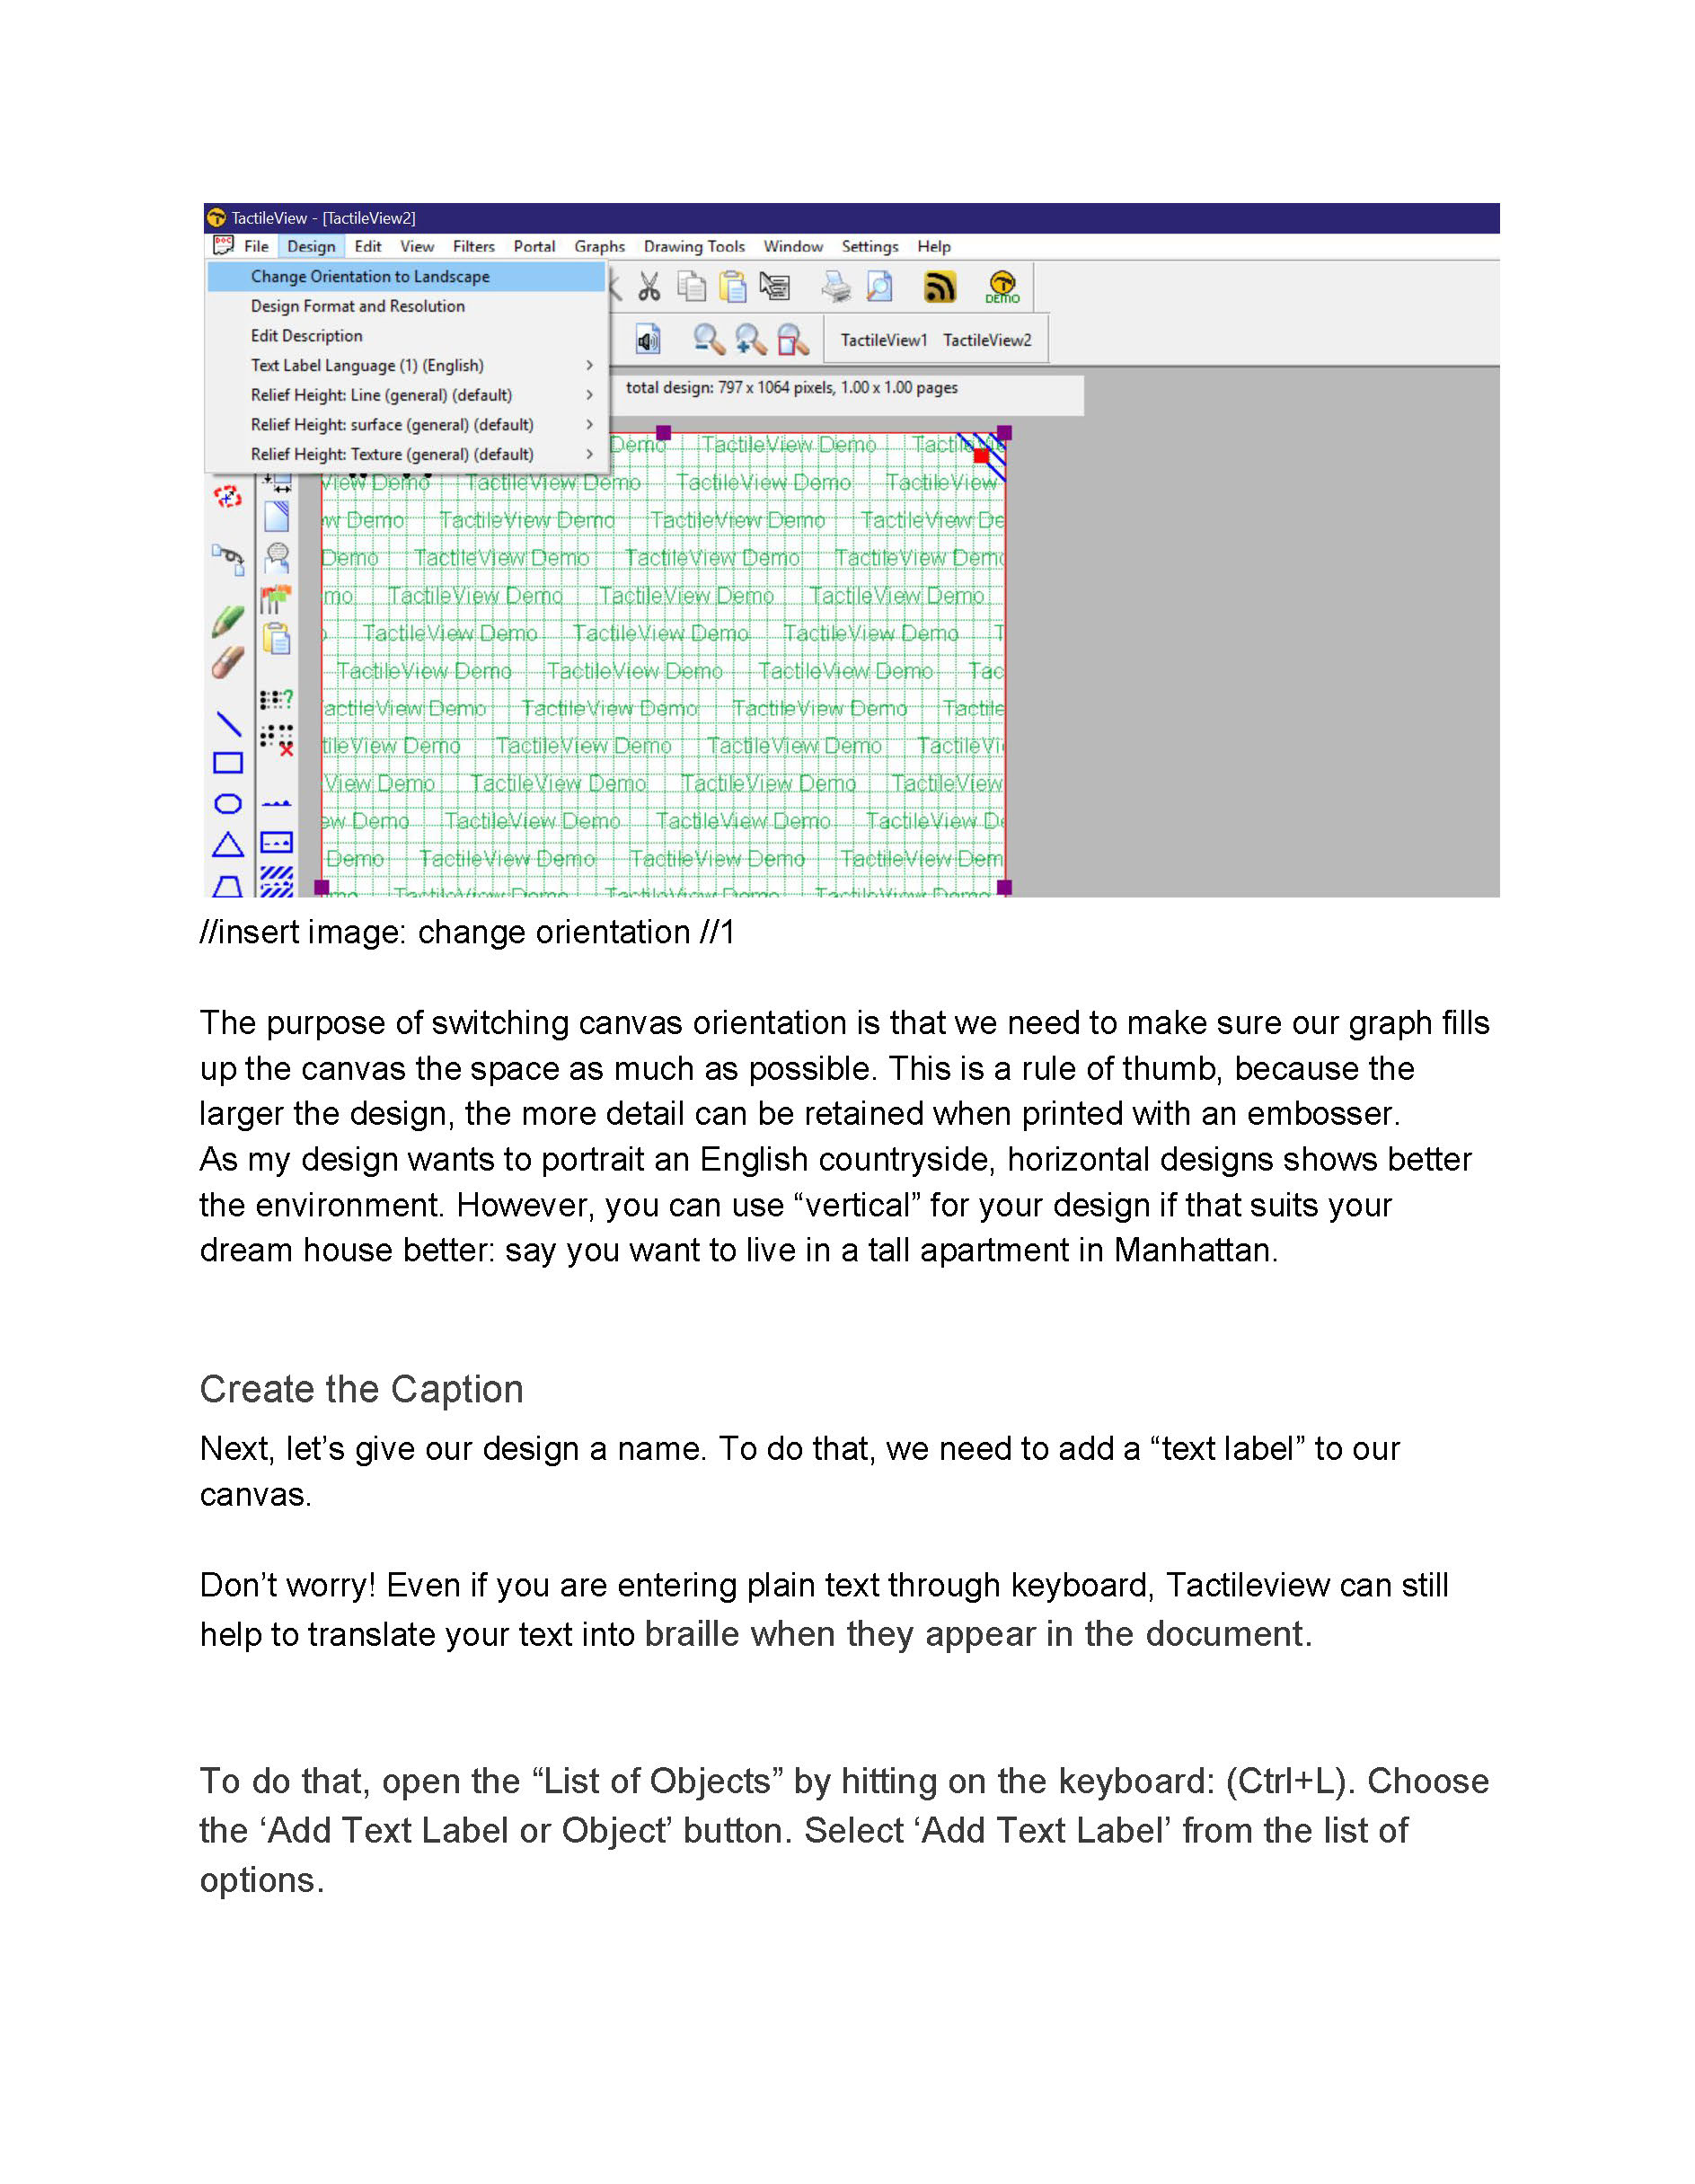
I lead research and design of an online accessible tutorial for TactileView, a software that creates tactile pictures for people who can not see.
This browser-based tutorial allows users to listen the tutorial content, while working in the TactileView software.
Overview
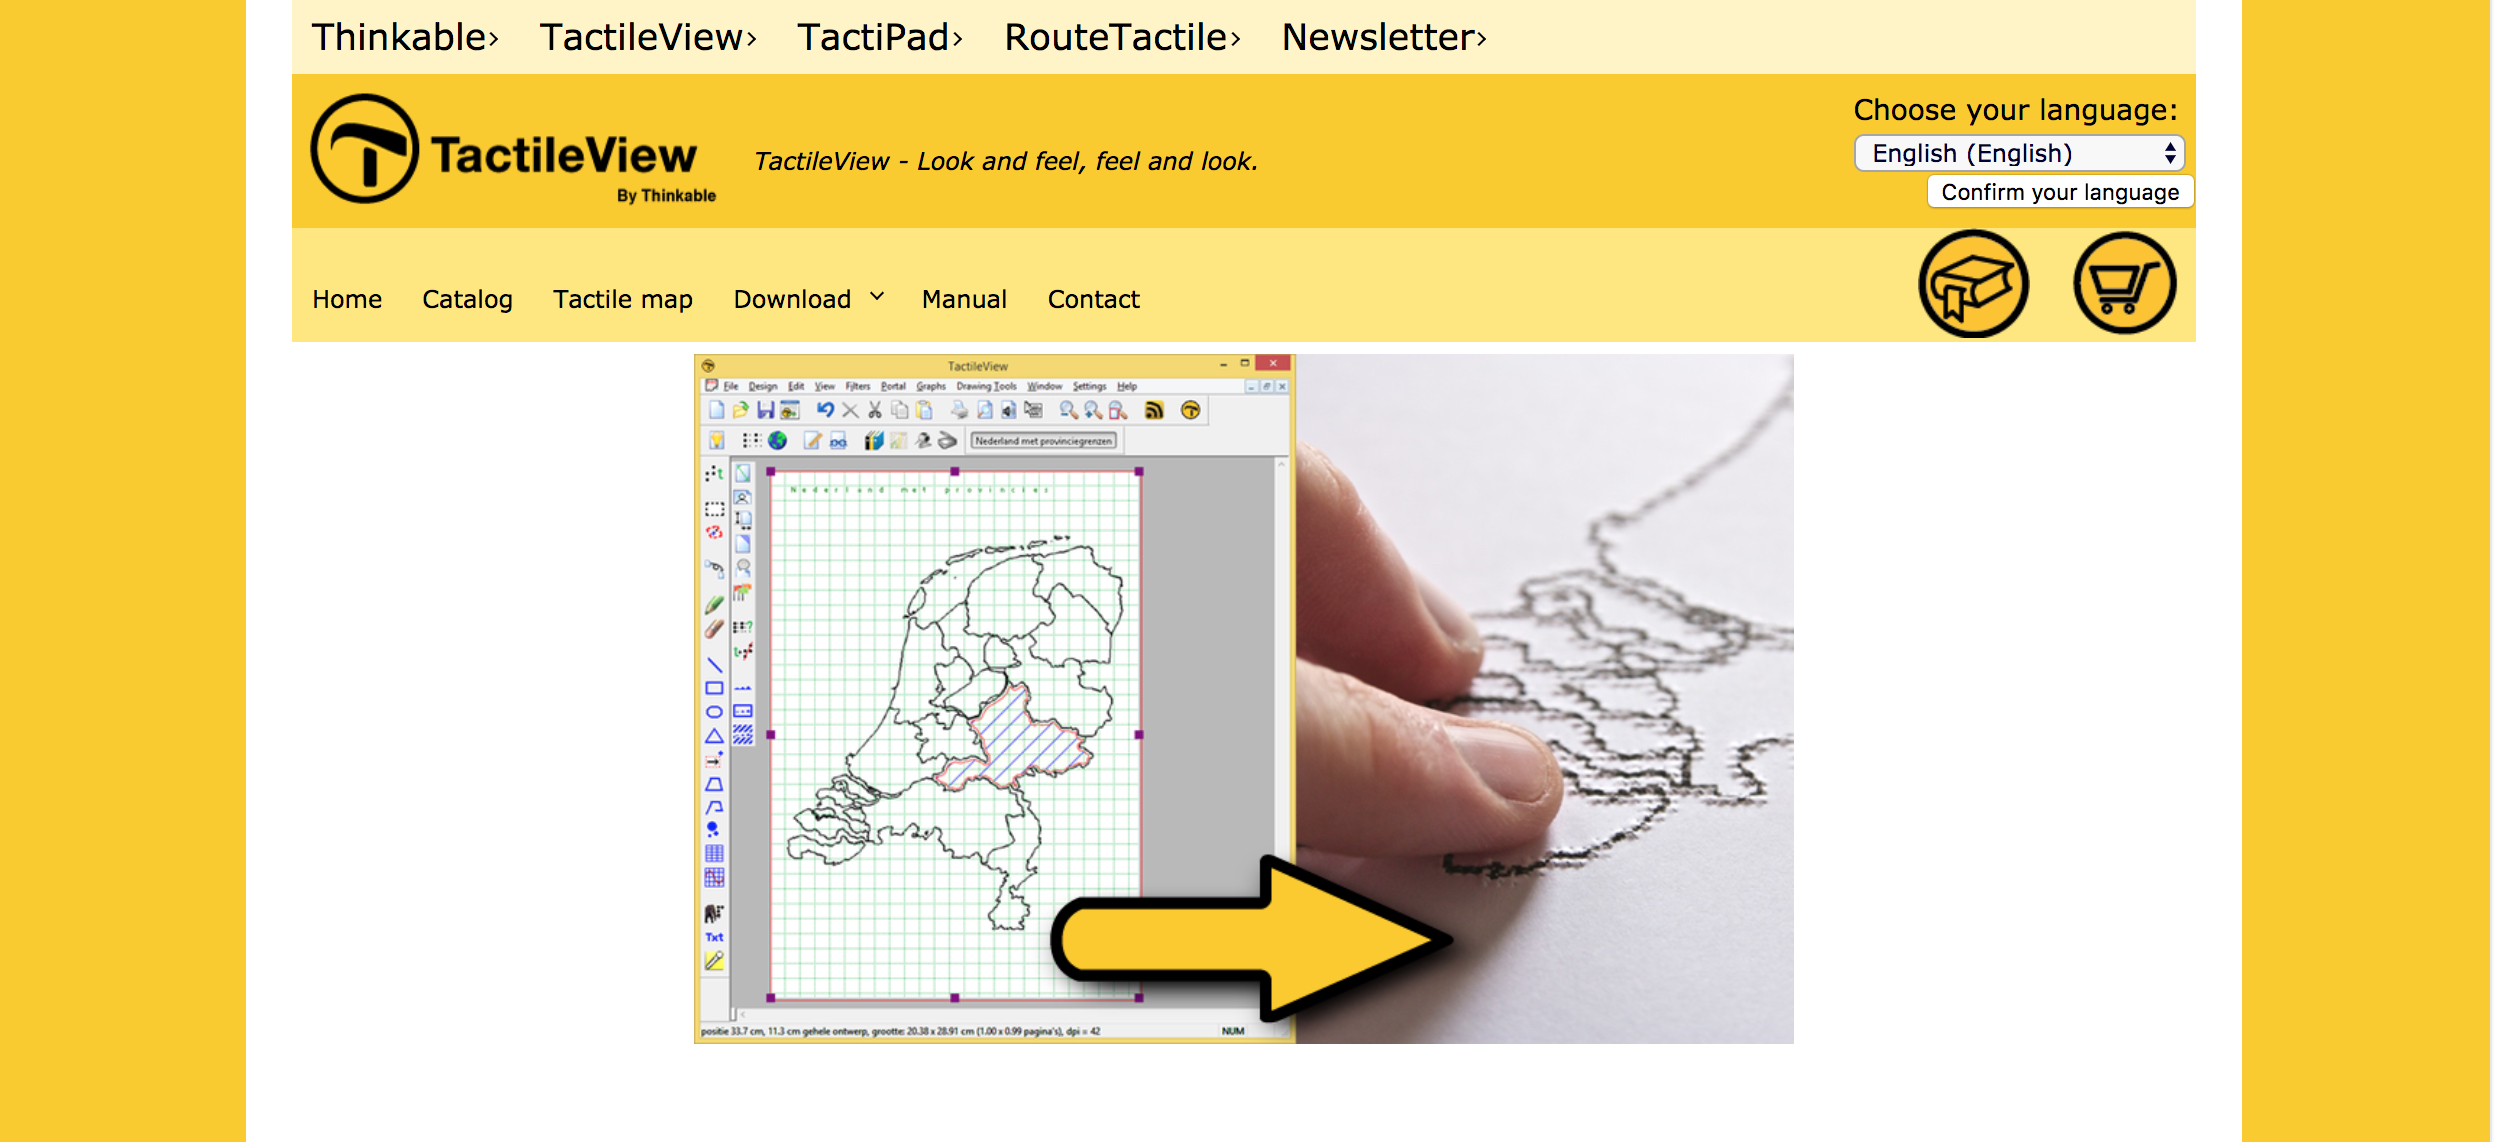
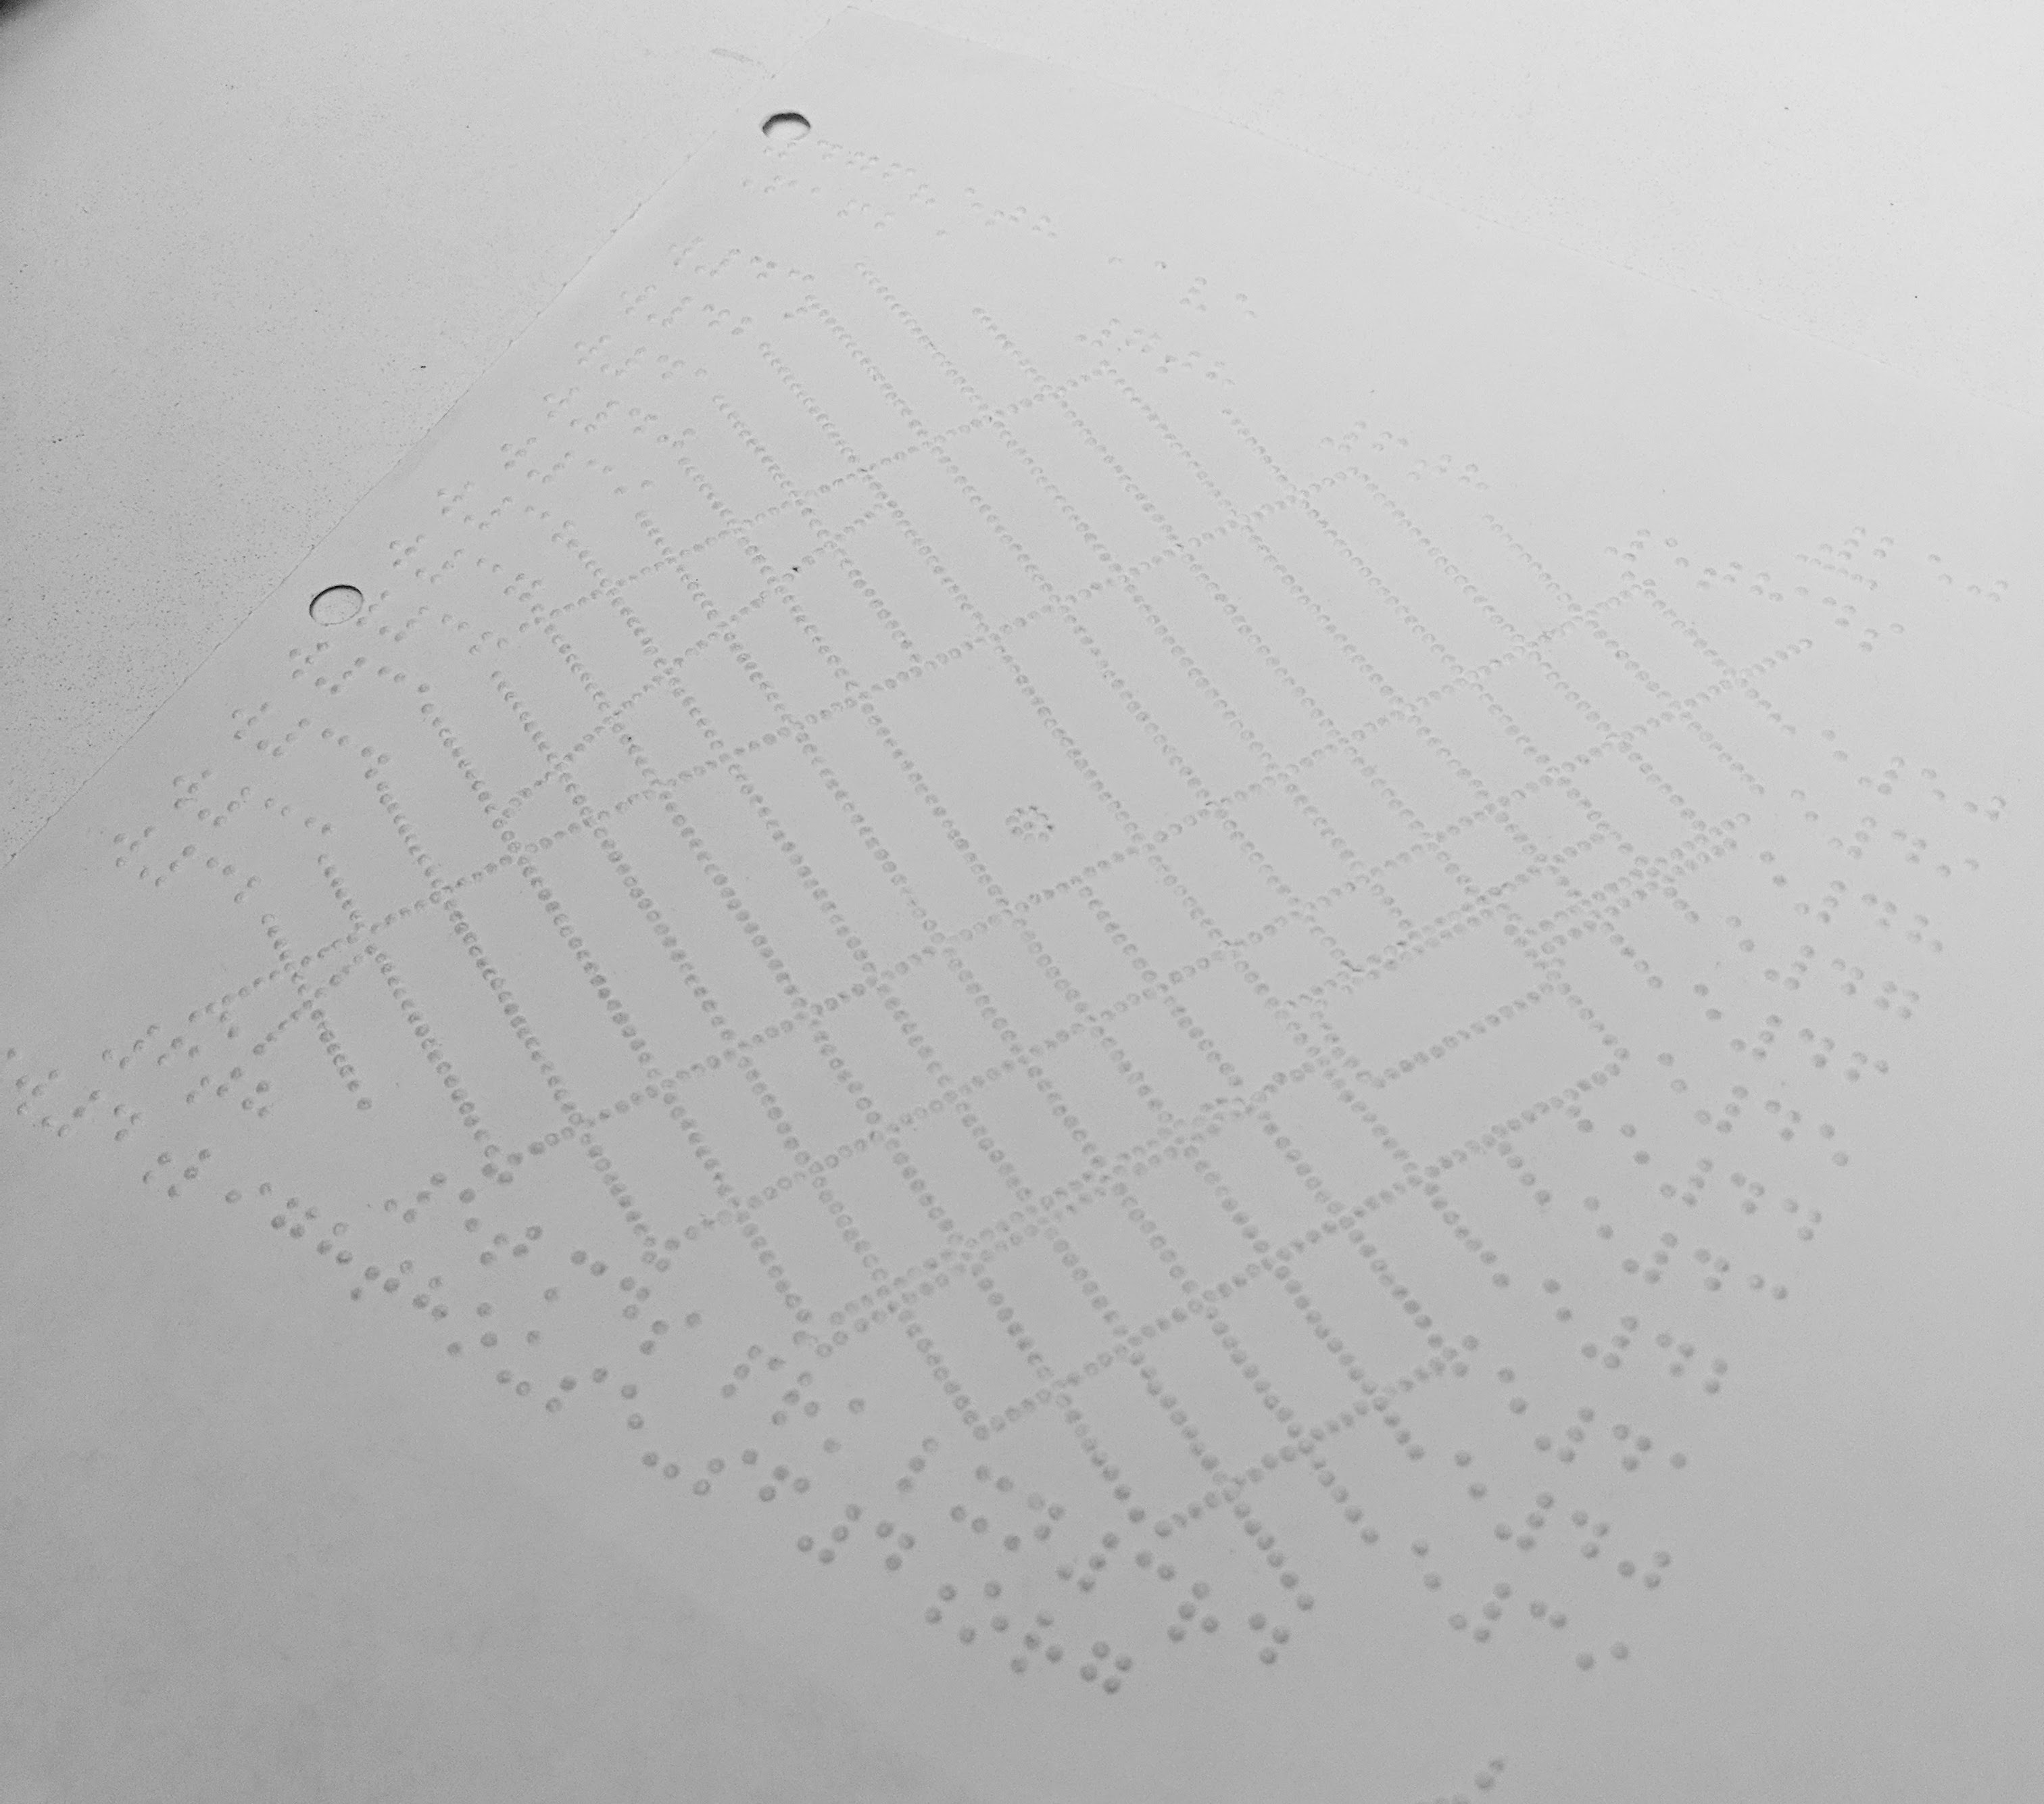
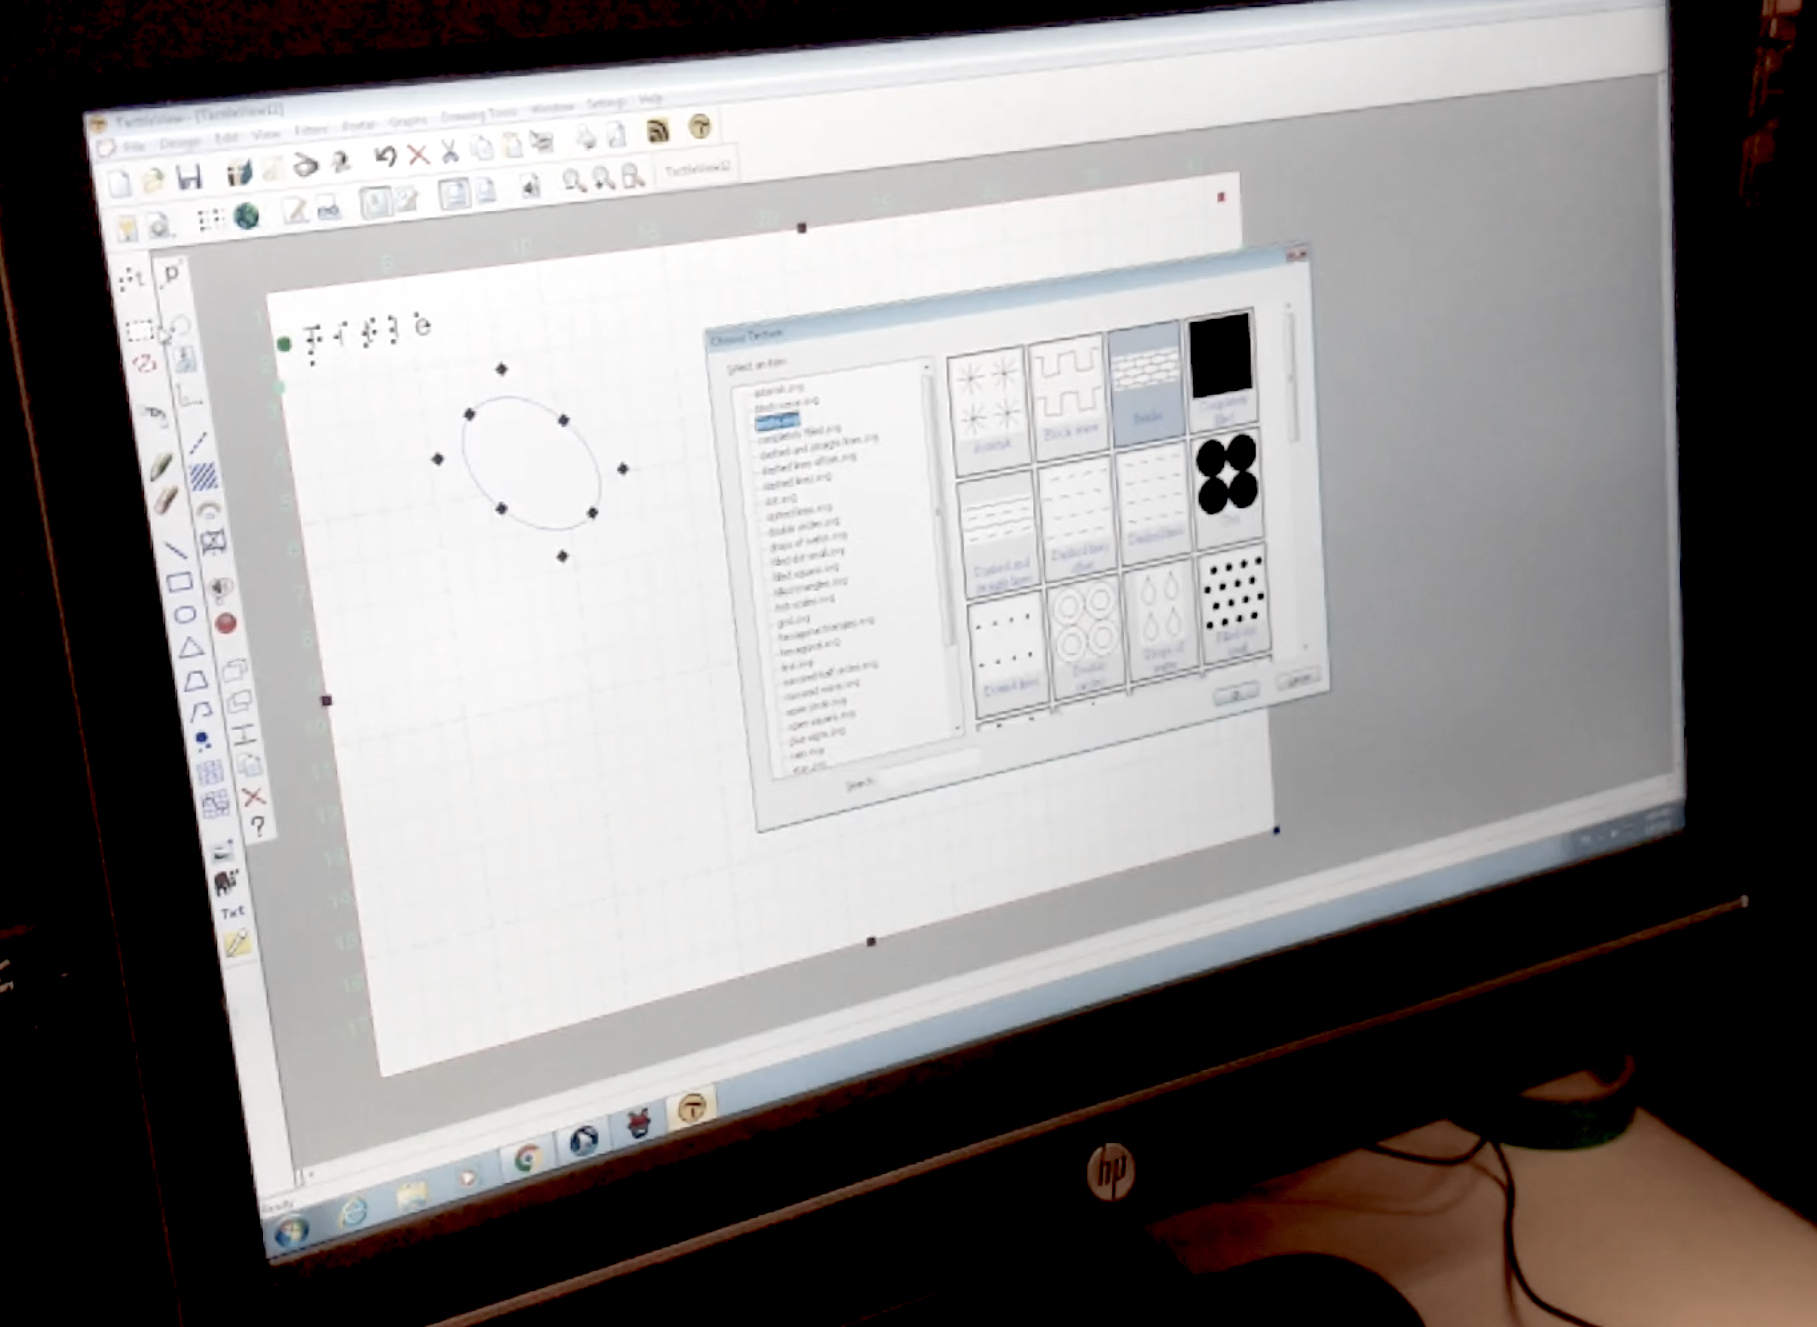
TactileView is one of the few existing software that helps to generate tactile graphics, a medium that helps the low-vision community to “read” graphs.
![]()
I was given the 1-month challenge to propose a feasible, ready-to-use solution for the Andrew Heiskell Braille and Talking Book Library to improve the learning and/or simplify the using experience of TactileView.
*The research finding was published by NYC Design on Medium.
Context
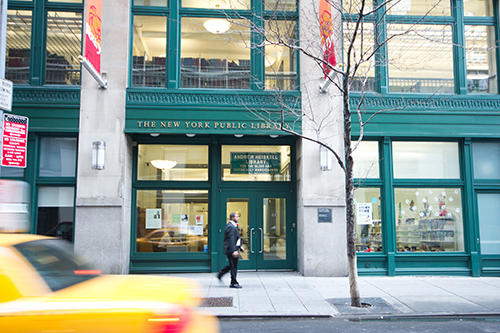
Andrew Heiskell Braille and Talking Book Library is the first library in the United States that opens its technology room to the public, by allowing both sighted and blinded individuals to generate and print out their customized tactile graphic.
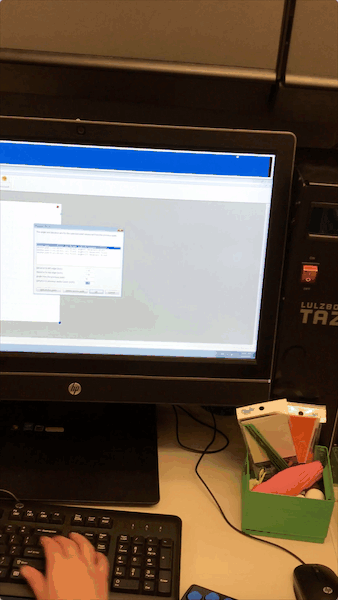
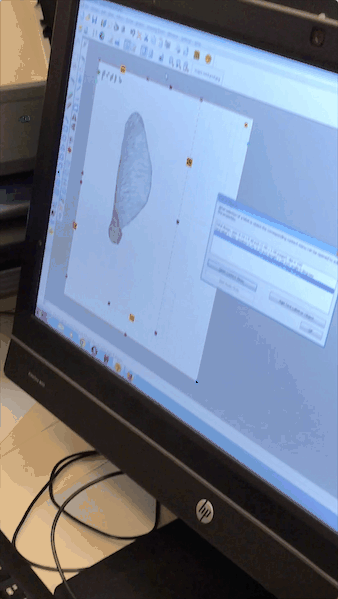
In order to introduce tactile mindfulness to more braille readers, it has set up a department dedicated to tactile graphics. There is a technology room equipped with a Windows Computer, TactileView software, an embosser, and technical support during booking hours. TactileView program only runs on Windows Computers.
![]()
In order to introduce tactile mindfulness to more braille readers, it has set up a department dedicated to tactile graphics. There is a technology room equipped with a Windows Computer, TactileView software, an embosser, and technical support during booking hours. TactileView program only runs on Windows Computers.
My team was given the 1-month challenge to propose a feasible, ready-to-use solution for the library to simplify the user experience of TactileView.
Contextual Inquiry
We started the project by conducting contextual inquiry to understand the low-vision population. We first viewed booked five appointments with Chancey Fleet and Rania, the technology assistant at the library and her assistant, to learn more about the topic.
![]()
![]()
![]()
![]()
![]()
![]()
Maps and floor plans are a necessity for the low-vision group, who can quickly get an idea of the space from them. Yet this kind of tactile graphics are rarely available. “Sometimes I will fly to another city to attend conferences. I am always having a hard time going out on my own, because I don’t have a map of the city, I cannot ‘read’ streets. That way I would get lost very easily.”
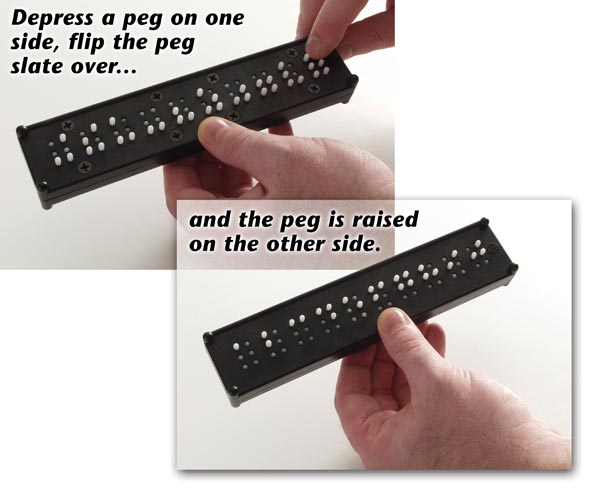
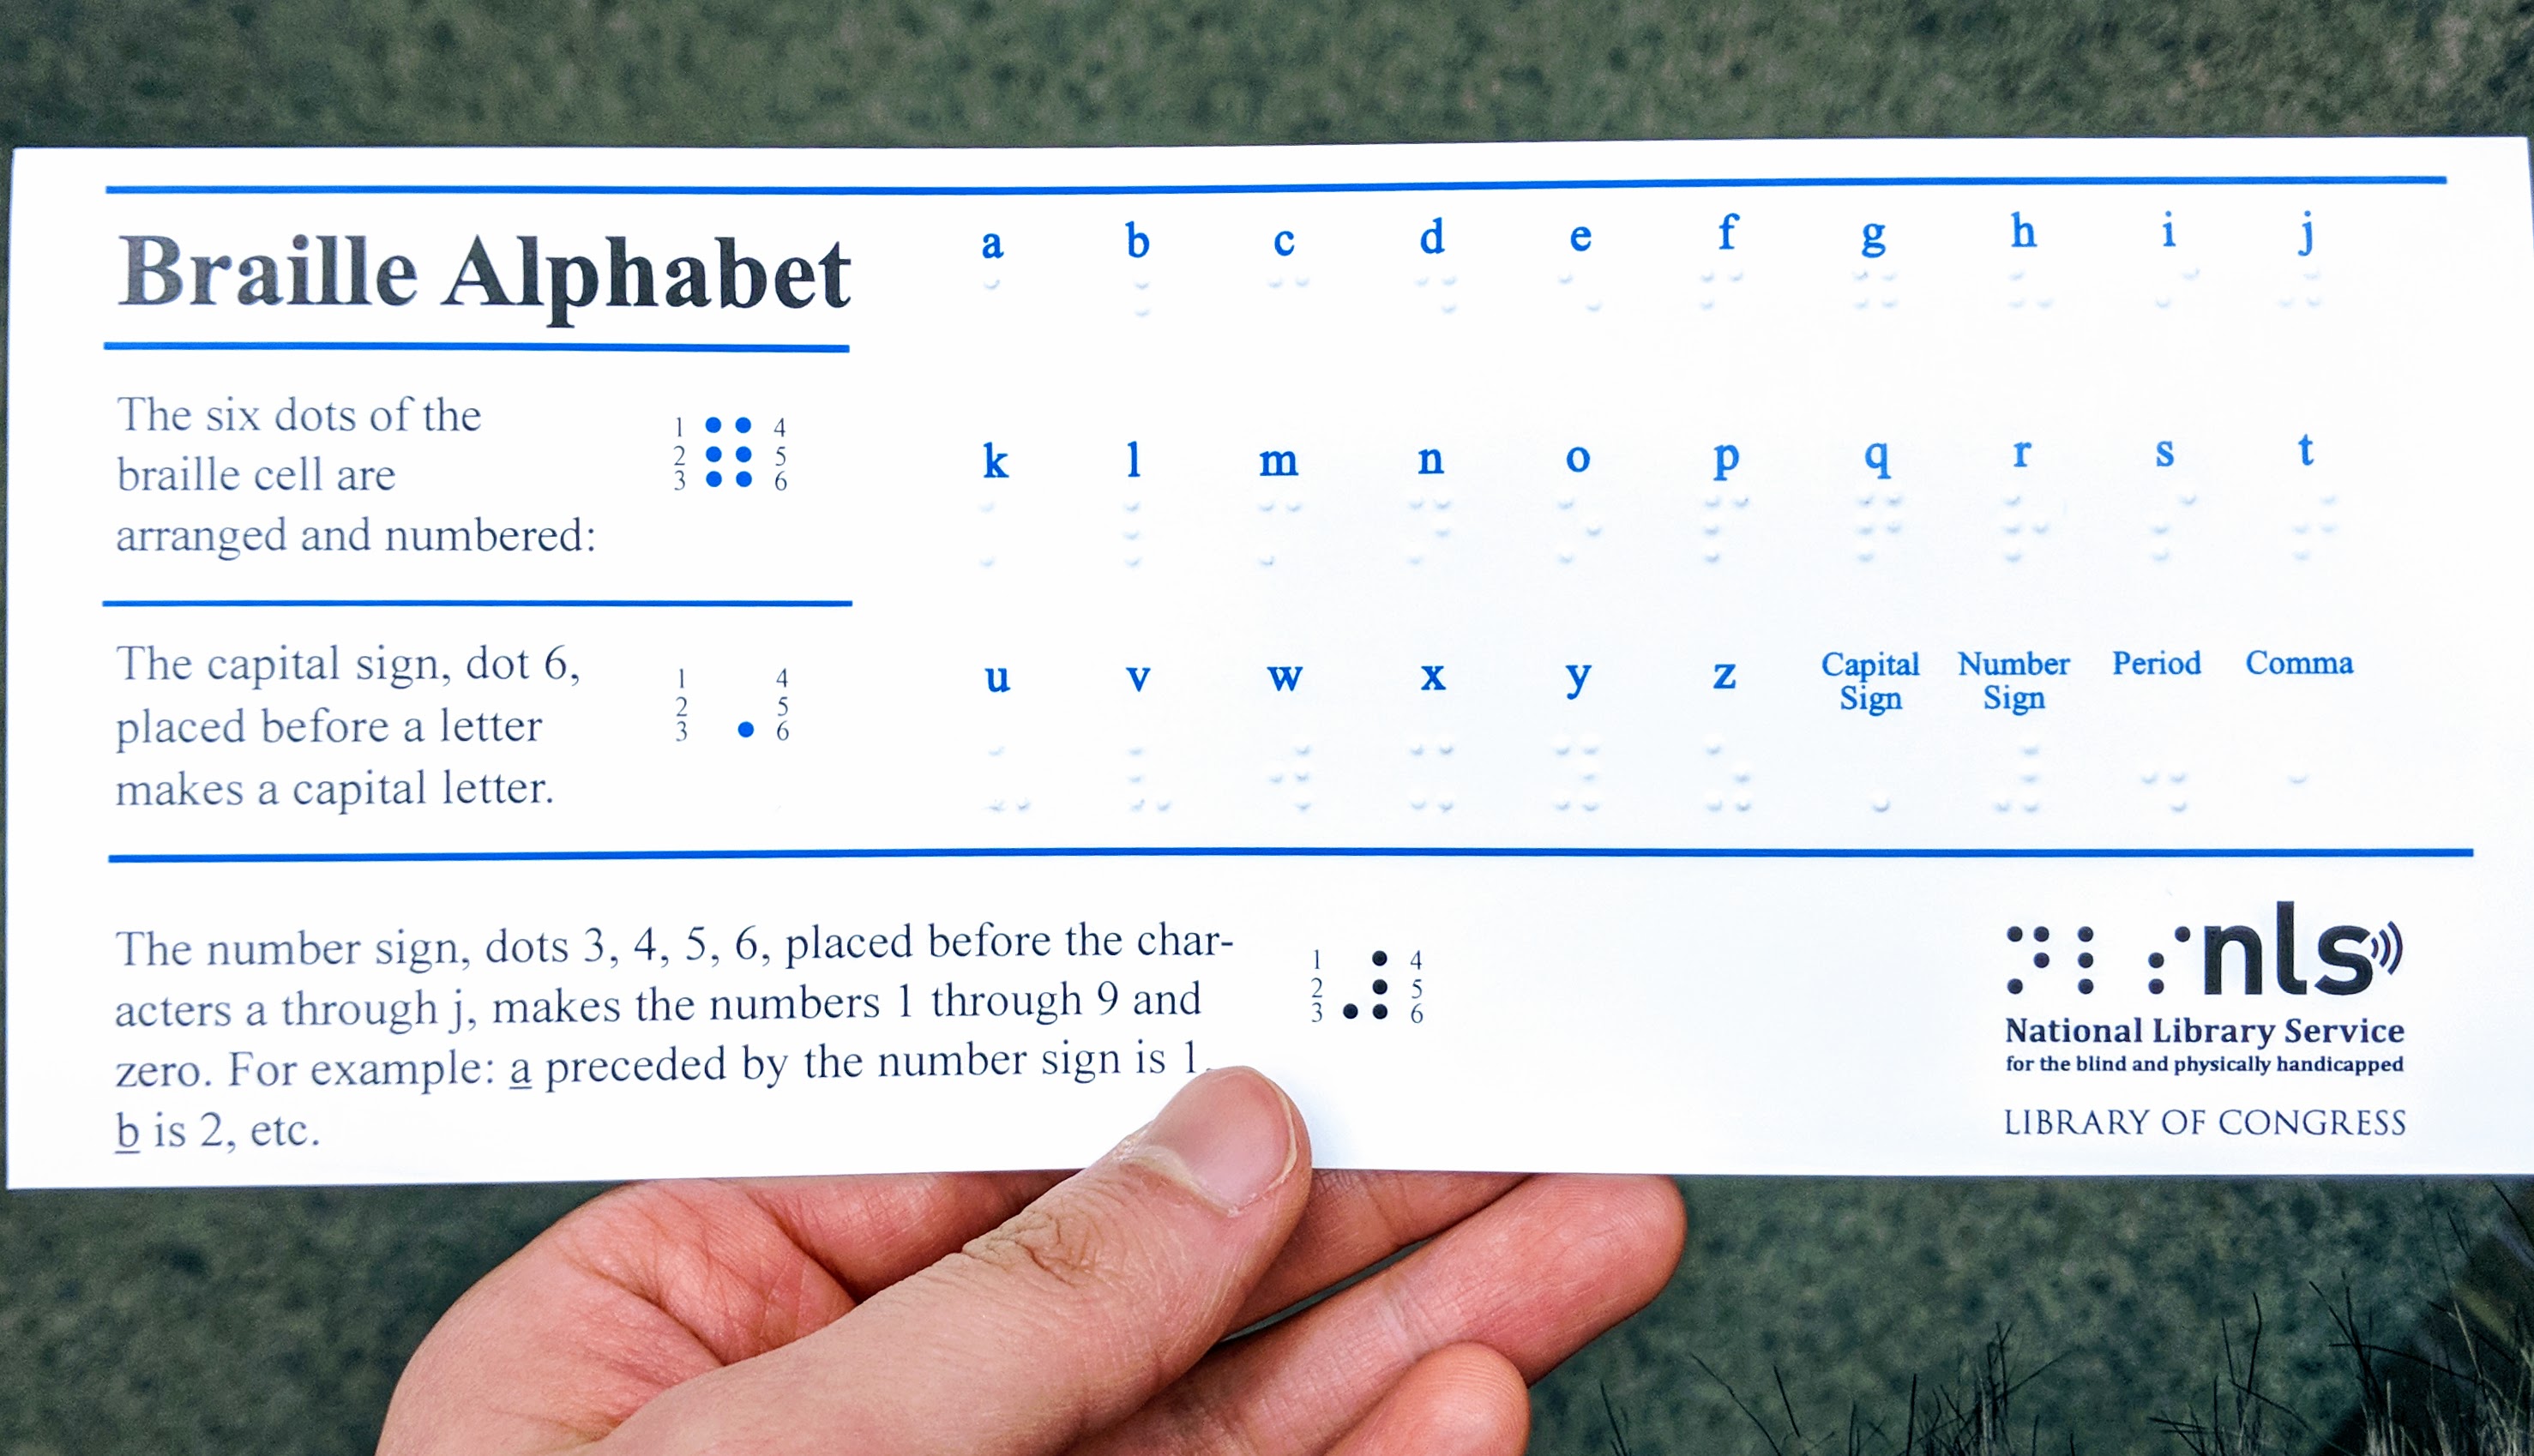
There are two terms that describe blind people’s engagement with braille: tactile mindfulness and tactile acuity.
Tactile mindfulness addresses the engagement with everyday objects, to the level of understanding of music, math, etc through touching. Tactile acuity addresses the ability to read the spatial relationship between braille elements. Most of the braille readers are trained in spatial acuity, which is helpful for text reading.
![]()
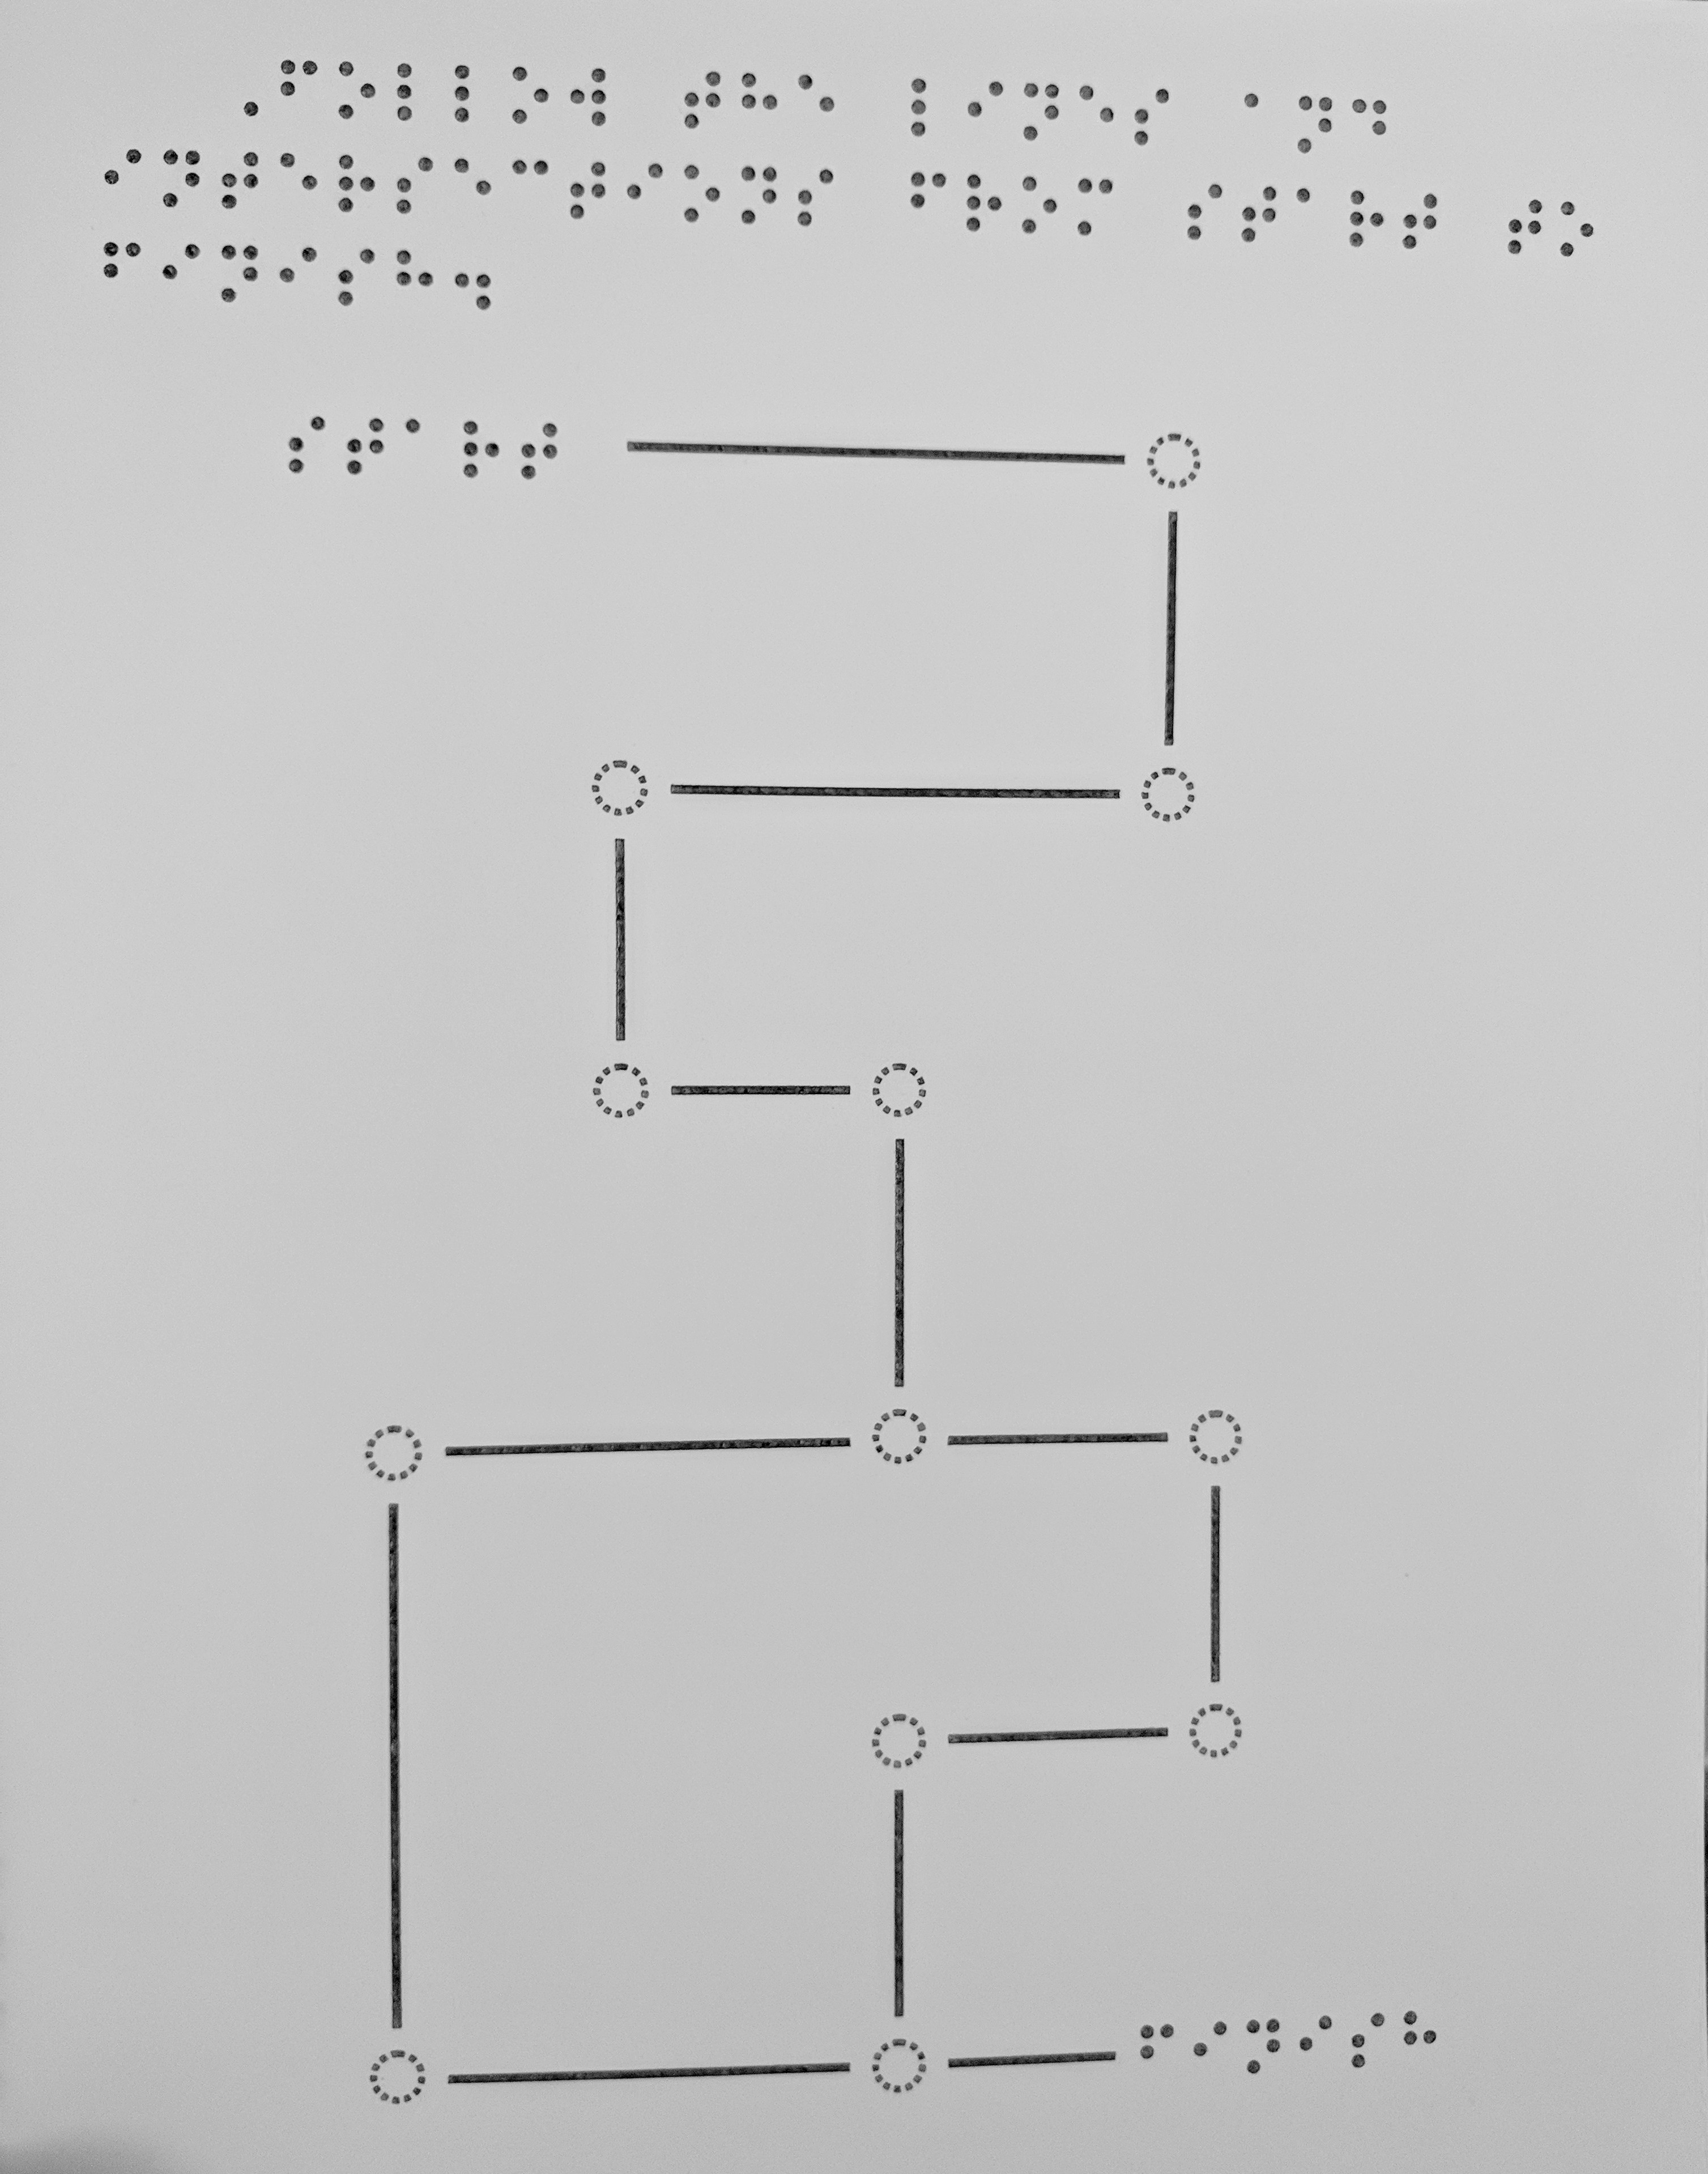
Chancey is the most braille literate person I have ever met. As soon as her hand slides through the paper surface, she understands the Braille texts immediately. She can even read bar charts on a tactile data visualization(the charts are dots with in line at various length), and tell at what percentage it is filled relative to the paper size. Being so well educated, Chancey admits that she didn’t know the term “tactile mindfulness” and “tactile acuity” until recently at a conference.
According to Chancey, most people with low vision are poorly trained at tactile mindfulness at school. Students can only encounter tactile graphics on rare occasions, such as graphs for math and physics.


There are a lot of Braille books available to the low-vision group, but the idea of tactile graphics is still a nuance.
Being the largest library that provides Braille books in New York city, the entire second floor of Andrew Heiskell Braille and Talking Book Library is dedicated to Braille books. However, there is only one shelf that store books with tactile graphics. While the subjects of the braille books range from computer science to leisure reading, books contain tactile graphics are limited to children’s story books, maze puzzles, and a tactile sample book made by the library.
Tactile graphics are underrated, and are in pressing demand.
Maps and floor plans are a necessity for the low-vision group, who can quickly get an idea of the space from them. Yet this kind of tactile graphics are rarely available. “Sometimes I will fly to another city to attend conferences. I am always having a hard time going out on my own, because I don’t have a map of the city, I cannot ‘read’ streets. That way I would get lost very easily.”
Tactile Mindfulness vs Tacile Acuity
There are two terms that describe blind people’s engagement with braille: tactile mindfulness and tactile acuity.
Tactile mindfulness addresses the engagement with everyday objects, to the level of understanding of music, math, etc through touching. Tactile acuity addresses the ability to read the spatial relationship between braille elements. Most of the braille readers are trained in spatial acuity, which is helpful for text reading.
Chancey is the most braille literate person I have ever met. As soon as her hand slides through the paper surface, she understands the Braille texts immediately. She can even read bar charts on a tactile data visualization(the charts are dots with in line at various length), and tell at what percentage it is filled relative to the paper size. Being so well educated, Chancey admits that she didn’t know the term “tactile mindfulness” and “tactile acuity” until recently at a conference.
According to Chancey, most people with low vision are poorly trained at tactile mindfulness at school. Students can only encounter tactile graphics on rare occasions, such as graphs for math and physics.
Research Synthesis
Two Workflows
The Library Audience
![]()
![]()
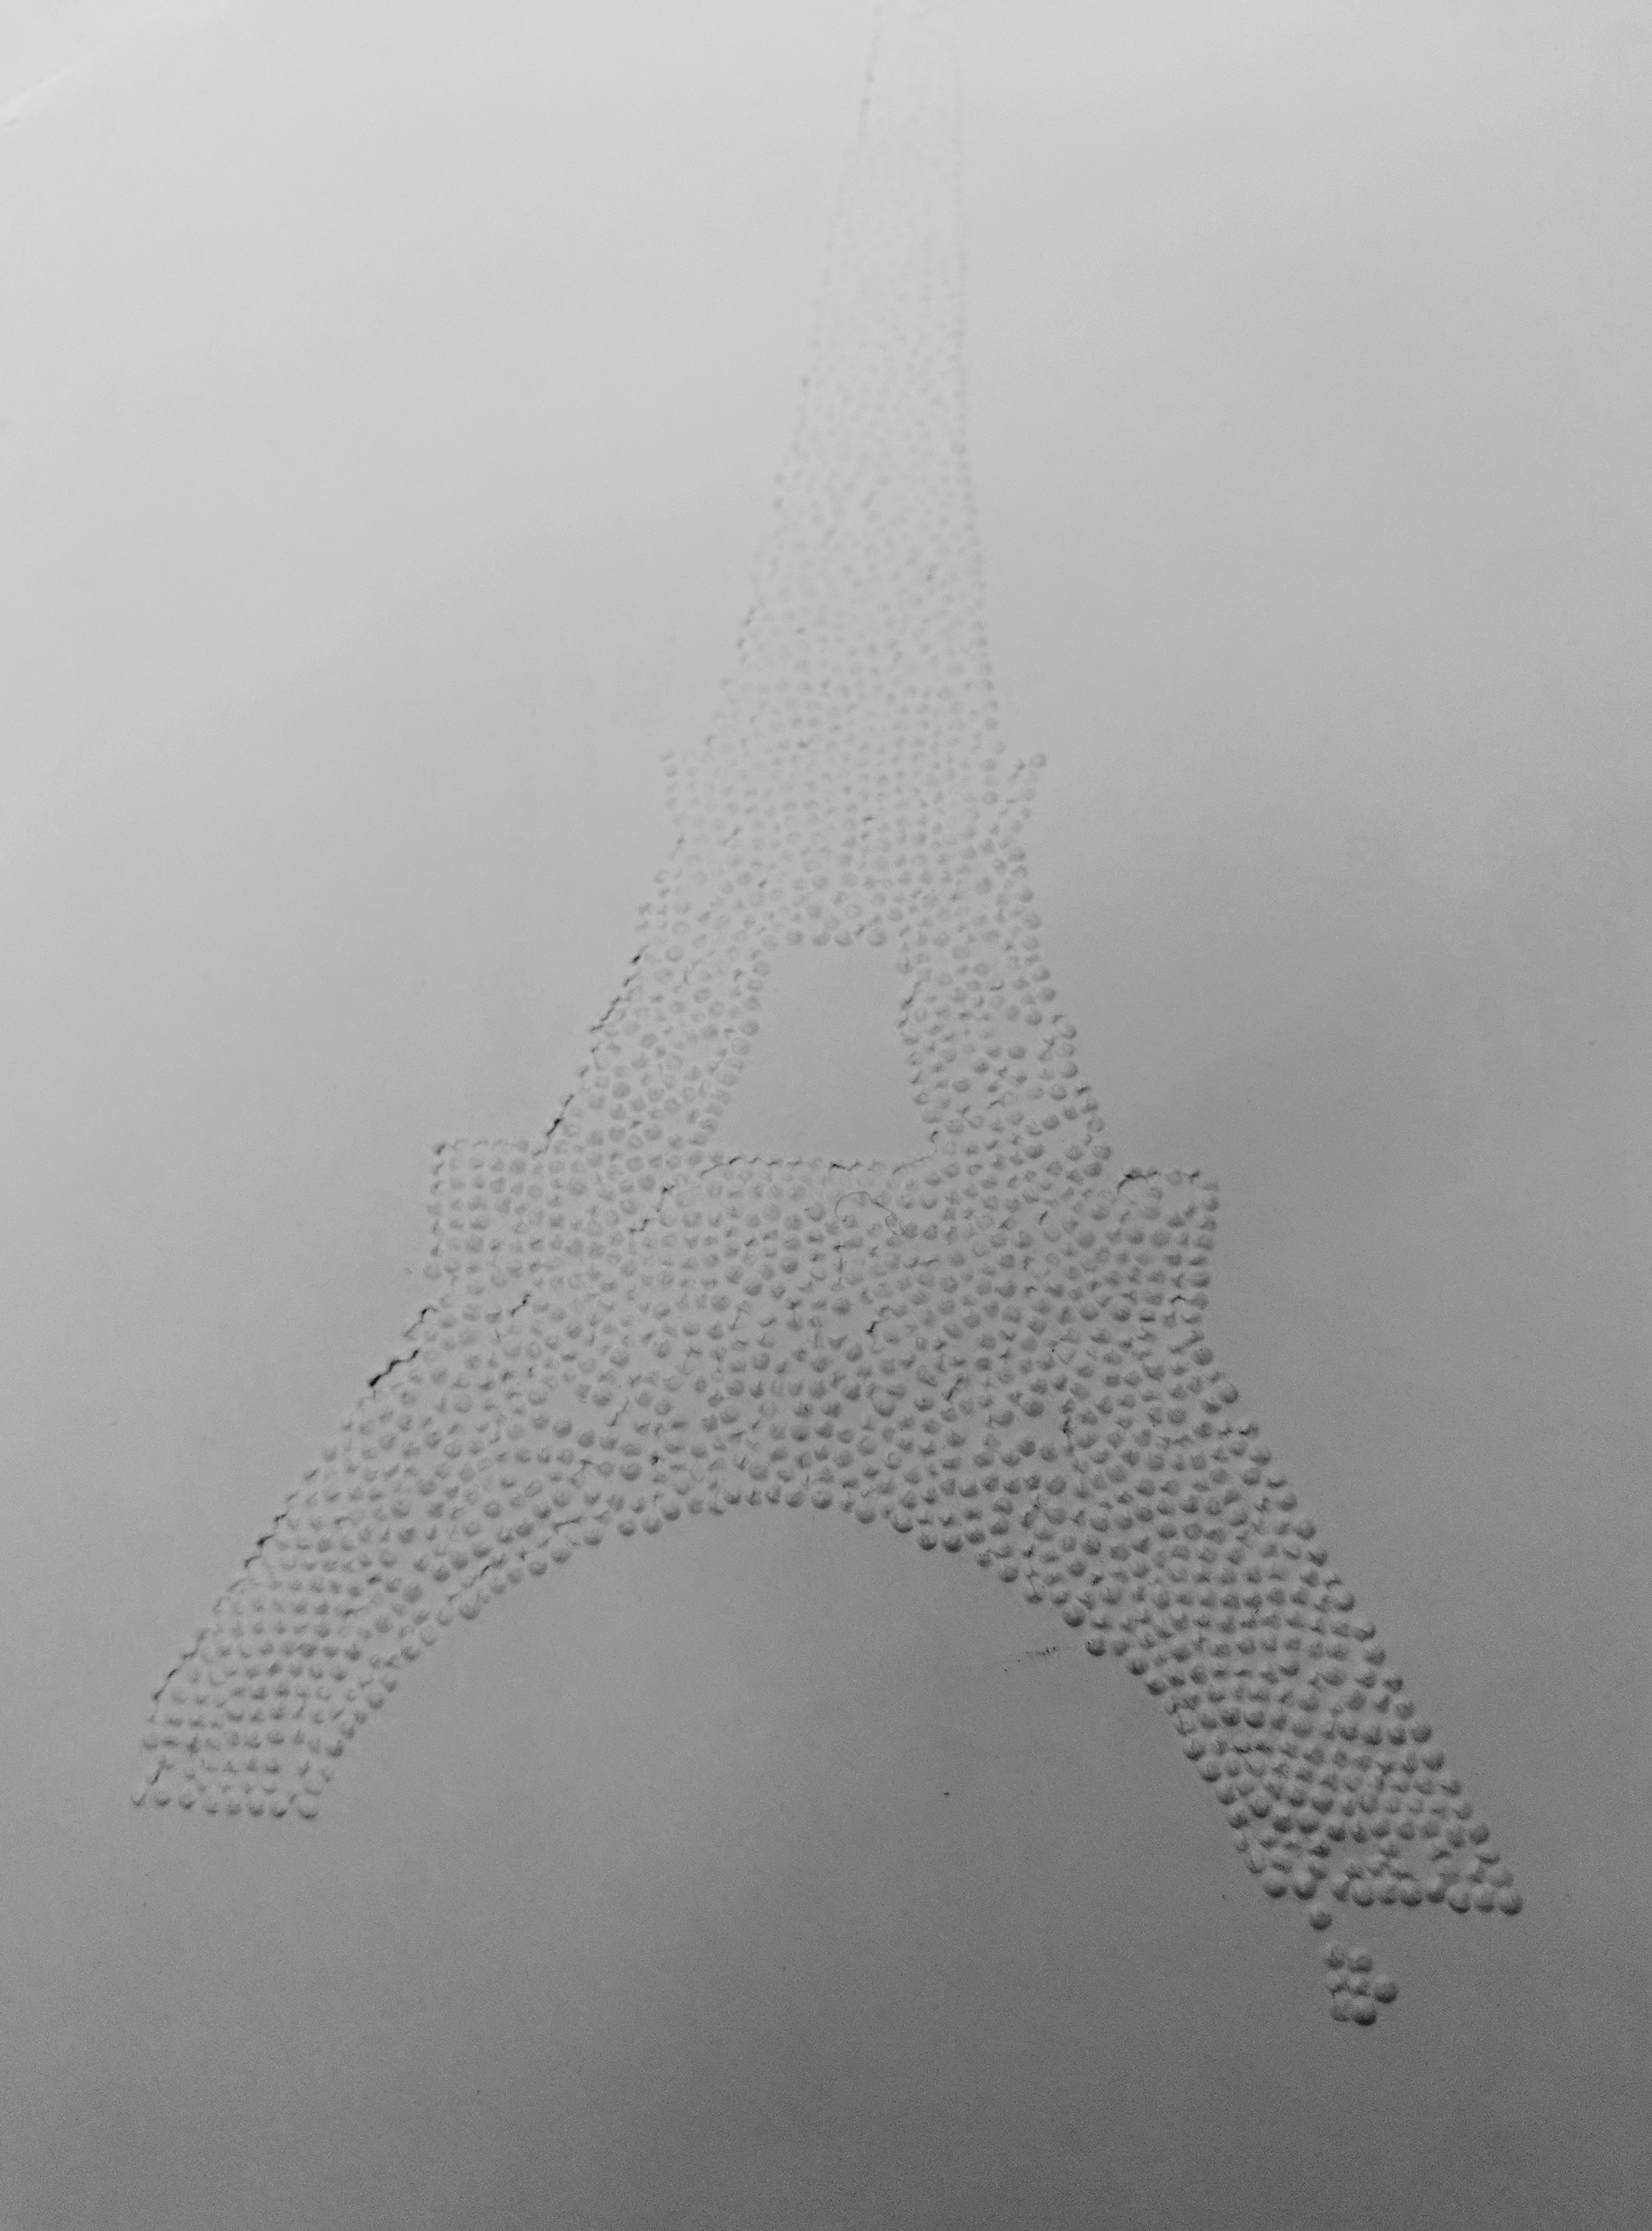
The need for tactile graphics come from all walks of life. There was an artist who wanted to create a stage plan for the blind audience, an students who wanted to create school projects with graphs, and a businessman who really wanted to visualize the logo of his own company.
Pain Points
Define Audience
Chancey brought up two interesting keywords: tutorial, design. She wishes for a tutorial that can help people learn TactileView better, with more insights from the design perspective.
After aligning Chancey’s envision and our preliminary problem statement, we decided to focus on tutorials that help people who are completely new to TactileView to create tactile graphics.
We defined our audience who are low-vision, new to tactile graphics design, and amiliar with voiceover on computers.
1. Collaboration between the sighted and the blind
In this case, the sighted work with Tactileview software. They process images, create graphs, and print out the tactile graphs. The blind are the designer and proofreader. They will give professional feedback on how the tactile graph can be improved in terms of readability.
2. The blind work alone
Since the blind are not able to process complicated images, so they usually work with simple image converting, or create simple graphics.
The Library Audience
In order to understand the audience, our group went to the Braille Studying session on Saturday lead by Chancey to conduct observation. We surprisingly found out that, most of the people who are visually impaired do not necessarily read braille, and many of them don’t get visually impaired until later in their life.
The need for tactile graphics come from all walks of life. There was an artist who wanted to create a stage plan for the blind audience, an students who wanted to create school projects with graphs, and a businessman who really wanted to visualize the logo of his own company.
Pain Points
- The application interface of TactileView is outdated.
-
TactileView is not inviting to people who have no prior experience with design software.
-
Most the tutorials target people with normal vision, rather than the visually impaired.
-
Many functions in the TactileView program are not applicable to menu-driven design.
- The only way to check if a design “feels” right is to print it out and touch it.
Define Audience
Chancey brought up two interesting keywords: tutorial, design. She wishes for a tutorial that can help people learn TactileView better, with more insights from the design perspective.
After aligning Chancey’s envision and our preliminary problem statement, we decided to focus on tutorials that help people who are completely new to TactileView to create tactile graphics.
We defined our audience who are low-vision, new to tactile graphics design, and amiliar with voiceover on computers.
User Testing
Rania invited girl A who to try out our mock tutorial. She didn’t get blind until sophomore year in college, and just learned how to use screen readers on her computer a year and a half ago. Beforehand, we practiced creating tactile graphics on our own, and created a set of instructions. We took some notes on how to use the keyboard, just in case she would need extra instructions.
Unfortunately, our first attempt was a failure. Having spent 2 hours working with A, she still did not proceed to the end of the process. This is mainly because A uses a Mac laptop rather than a Windows PC. Mac and Windows use separate screen readers: Mac uses VoiceOver, and Windows uses JAWS. Besides the confusion on keyboard commands, she was not able to launch JAWS on Windows in the beginning. Moreover, Google image search with screen readers and keyboards turned out to be extremely frustrating. This is something that our team was unprepared of. Ironically, 70% of the time spent on user testing was spent on figuring the keyboard commands to grab images from google.
![]()
![]()
![]()
Iteration
The user testing pushed us to reflect on our persona and problem statement. Our definition of the audience is too broad, and we need to come up with a more specific problem statement that addresses the need of a more specific group.
We also conducted another interview to know what the technical support staffs need to help make their work easier.
- People who want to create tactile graphics already had enough computer proficiency.
- The tutorial should teach users basic but essential features.
- The design of the tutorial should be engaging and interactive.
- The tutorial should focus on content creation rather than the format.
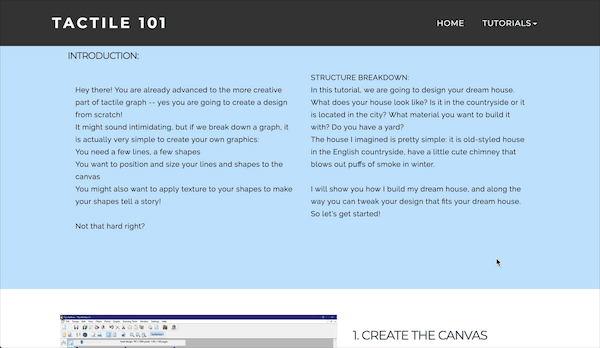
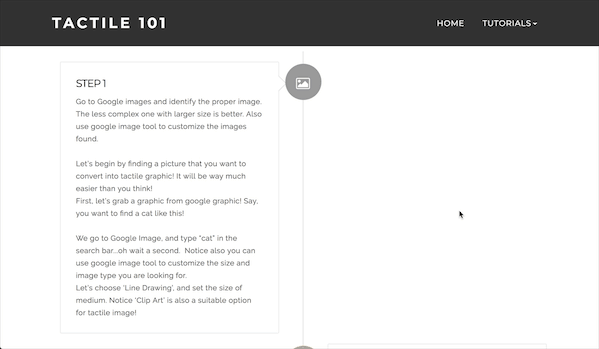
Design Response
Most of the blind people do not have much tactile awareness education, and they don’t understand the importance of tactile graphs. They need a way to boost their confidence and interest in using TactileView software. A tutorial can comfortably lead them to further exploration in the field.
By creating an interactive tutorial with both explanatory graphics and text in an intimate tone for beginner users, we will achieve the goal of leading them to further explore the software with comfort and interests. We will know this to be true when users can easily create their first design with the tutorial, and have the interest and ability to create more designs.
Design Principle
ACCESSIBLE
People use either Mac or Windows can navigate the website easily with that screen reader that they are familiar with.There is readability to both people with normal vision and the visually impaired.
PROJECT BASED
Instead of teaching through key functions, the tutorial teach by asking the users to finish different project challenges, assorted by levels of difficulty. We believe that “learning by doing” is the best practice to approach a software.Easy project: focus on the skill of creating graphics shapes, apply patterns, and layering.Difficult project: involve image processing with filter and conversion.
FRIENDLY TONE
The language and tone used in the tutorial should be very friendly and beginner level, as if your friend is talking.
Takeaways
Empathy is not easy
While signs of accessibility is everywhere in our daily life, for most of us, our understanding of the disabled people is very limited. Our team made a lot of false assumptions, and we didn’t notice our mistakes until we put ourselves first as users.
Co-design is about listening, not obeying
Chancey is one of the people that I respected the most: she is smart and decisive. She knows very well what she wants, and what she doesn’t want.
When we approached her for the research, she was very assisting. This somehow made us overly dependent on her expertise. We would tell her several solutions we had in mind, and ask about her opinion.
Later we learned that it is not the best idea in the world. While we are taking her opinions into account, we also lost control of our line of thought and analysis. When she figured that we are going for an direction she doesn’t like, she would stop feeding us information, and started to talk about her idea of the project.
We learned to ask questions more smartly. We catered several questions that simply asked about facts, rather than opinions. That made our research so much smoother.