Broadcast
2020, Seattle, US
Advised by
Audrey Desjardins
Research Team
Jena McWhirter, Jeremy Viny, Justin Petelka, Miki Bin, Philbert Widjaja, Ruby Peven
Project Partner Ruby Peven
Project Partner Ruby Peven
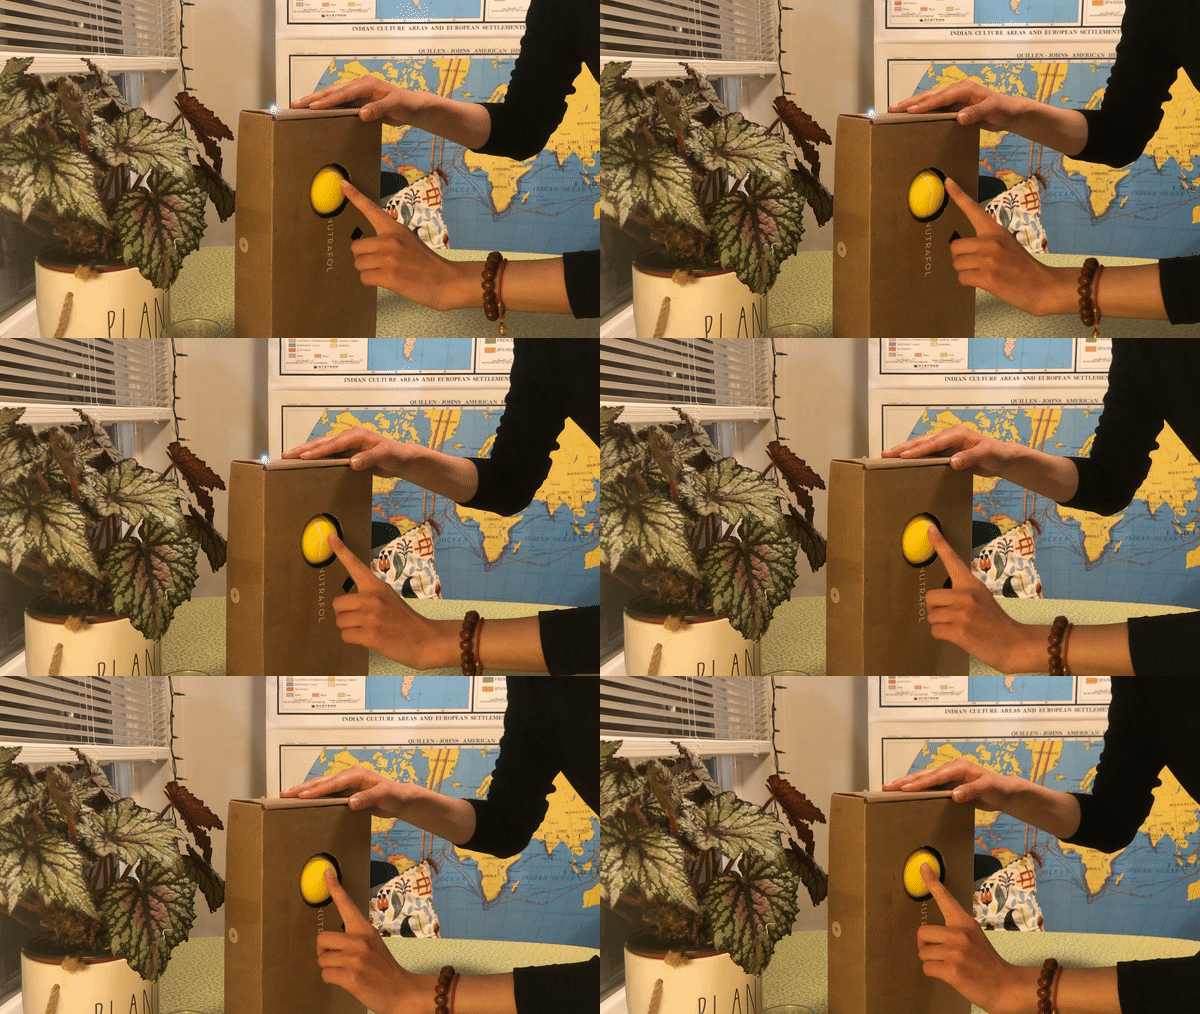
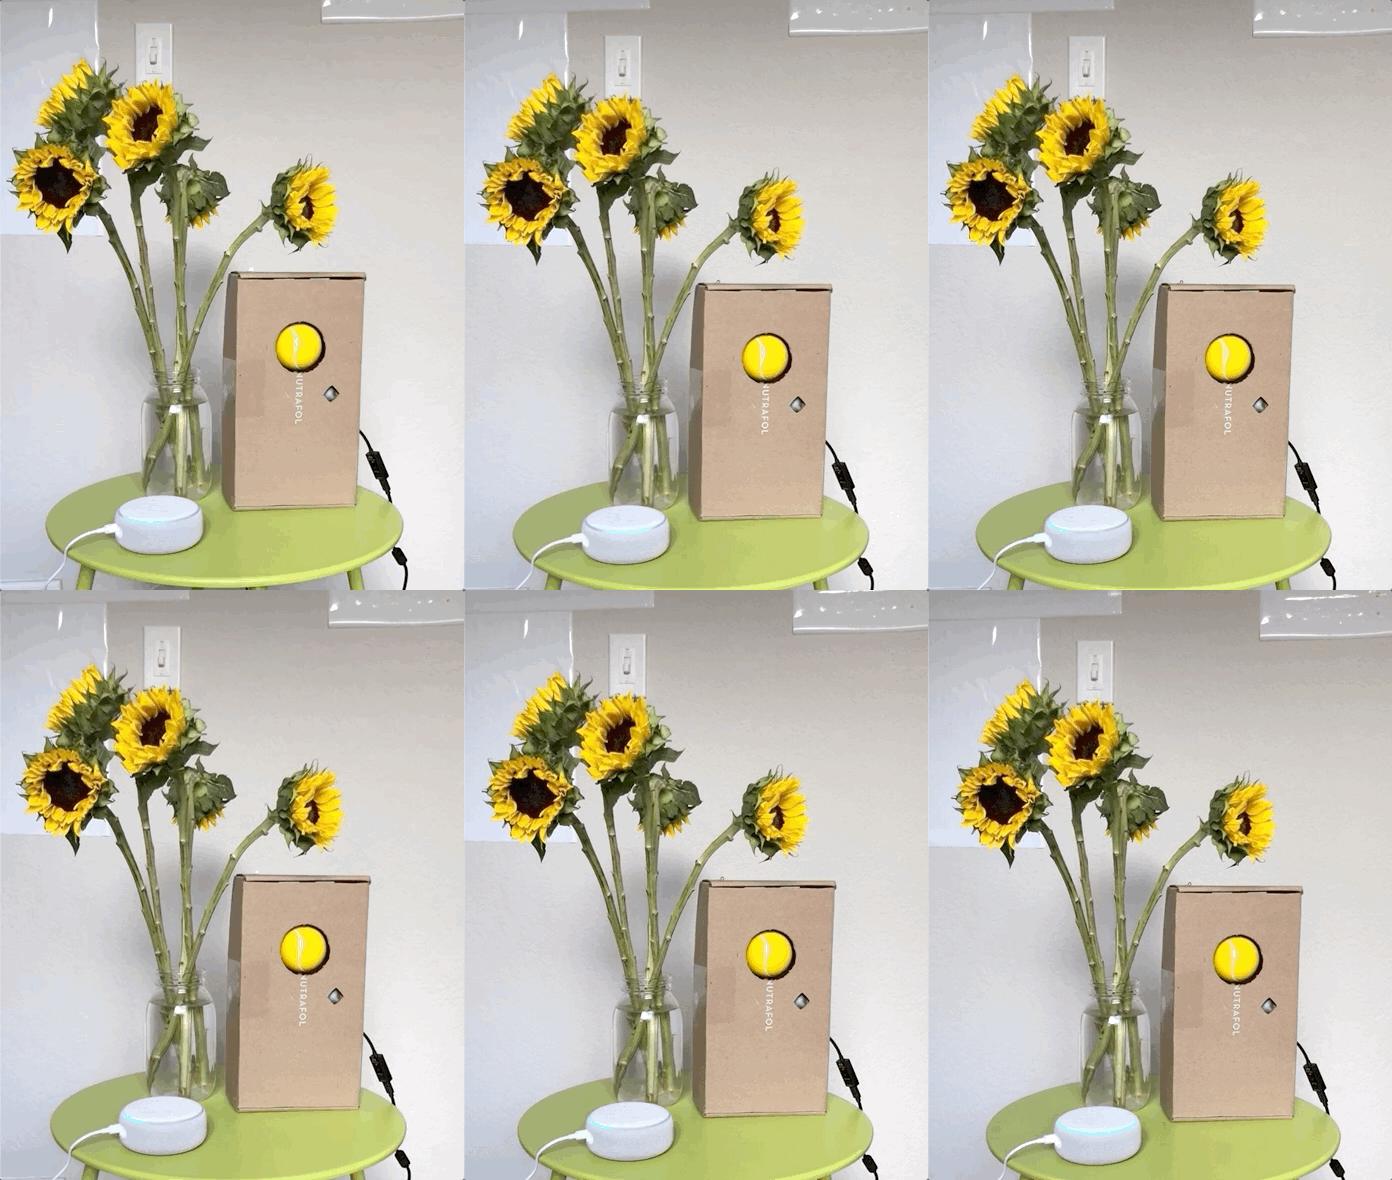
Broadcast is a device that allows people to listen to audio clips that broaden our imaginaries about IoT data travel in and out of the home.
Design Research Group Study of "Entanglements and Encounters of Data in the Home". Led by Assistant Professor Audrey Desjardins (UW).
Overview
This is a research project that inquires potential avenues for engaging with the IoT data in the home.
While people often choose to add IoT devices to their homes for the convenience or functionality they provide, they rarely think about the data that are captured through their everyday use. In this project, we propose to fabricate objects that can help reveal those data.
Particularly, we are making “Broadcast”. It is a product that reveals how data travels in and out of the home through imaginary leaps.
Theoretical Framing
We believe that imagination is an active way of acquiring knowledge about data.
Some existing HCI work related to design fiction and critical design formed our hypothesis that imaginative storytelling can be a way to acquire knowledge, which is different from scientific comprehension of that knowledge.
![]()
Fiction allows us to imaginatively enlarge our point of view.
-Mark Blythe, Enrique Encinas
Initial Idea
Imaginative storytelling can be a way to acquire knowledge.
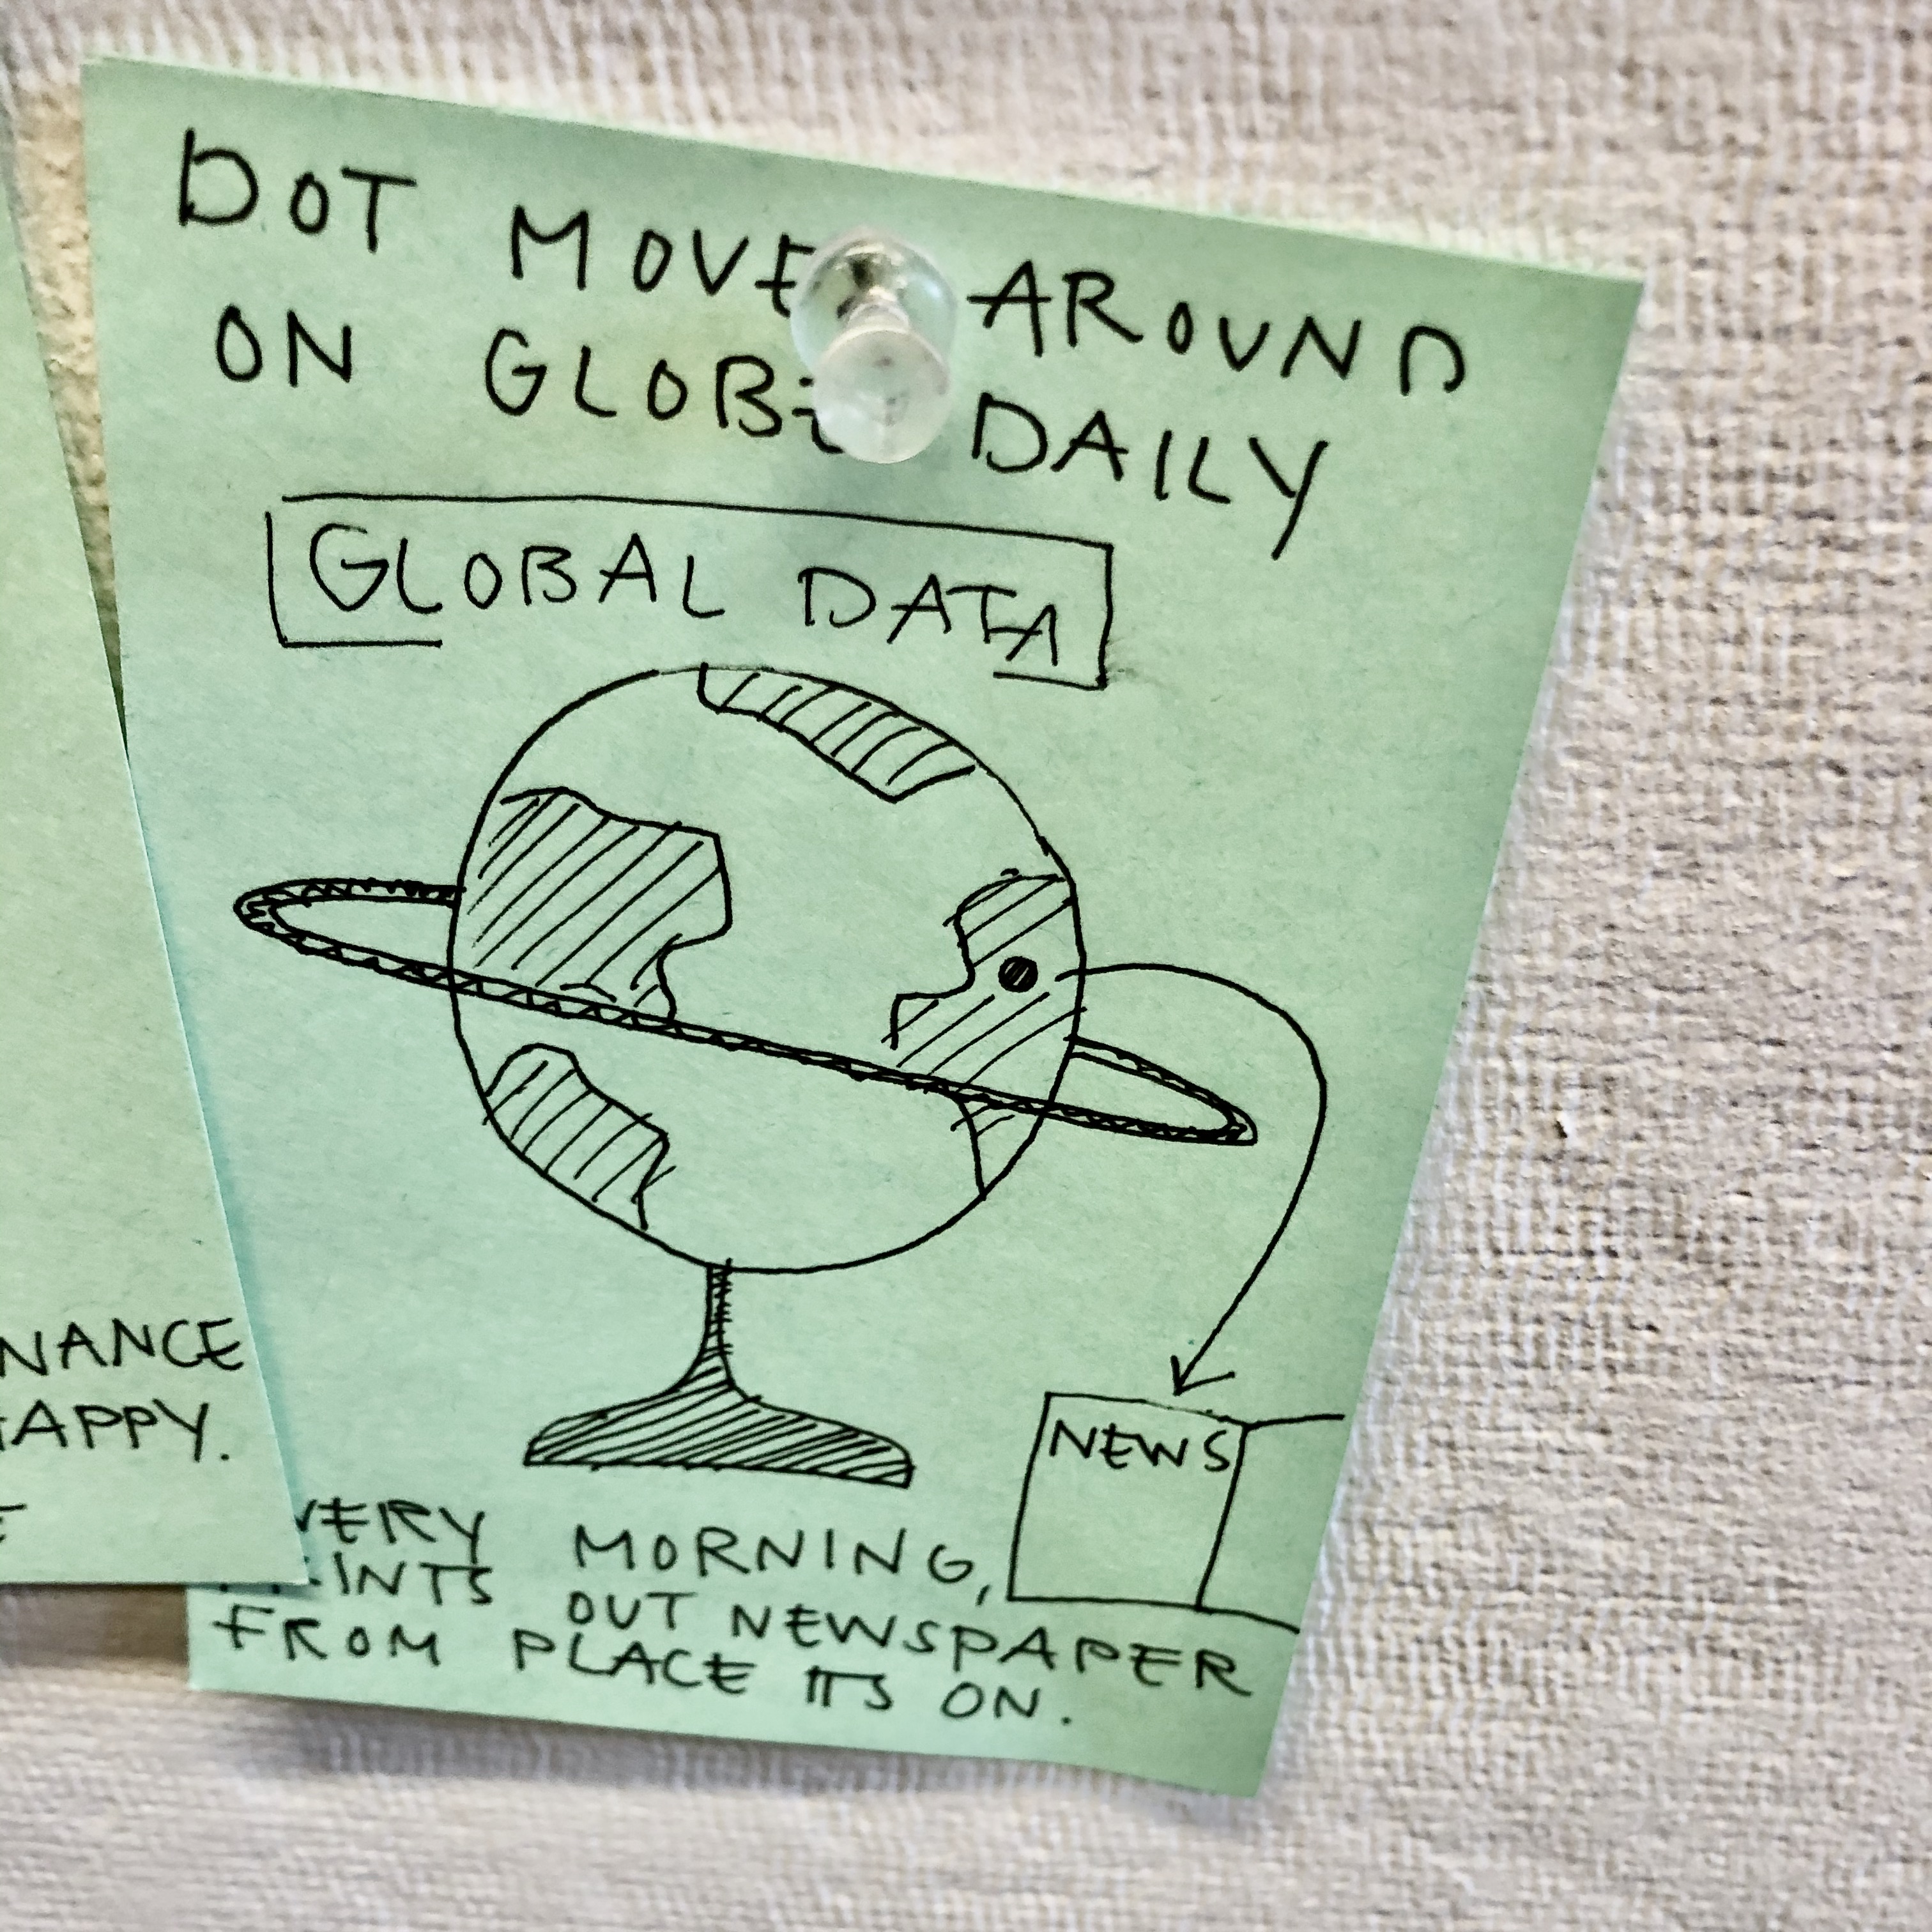
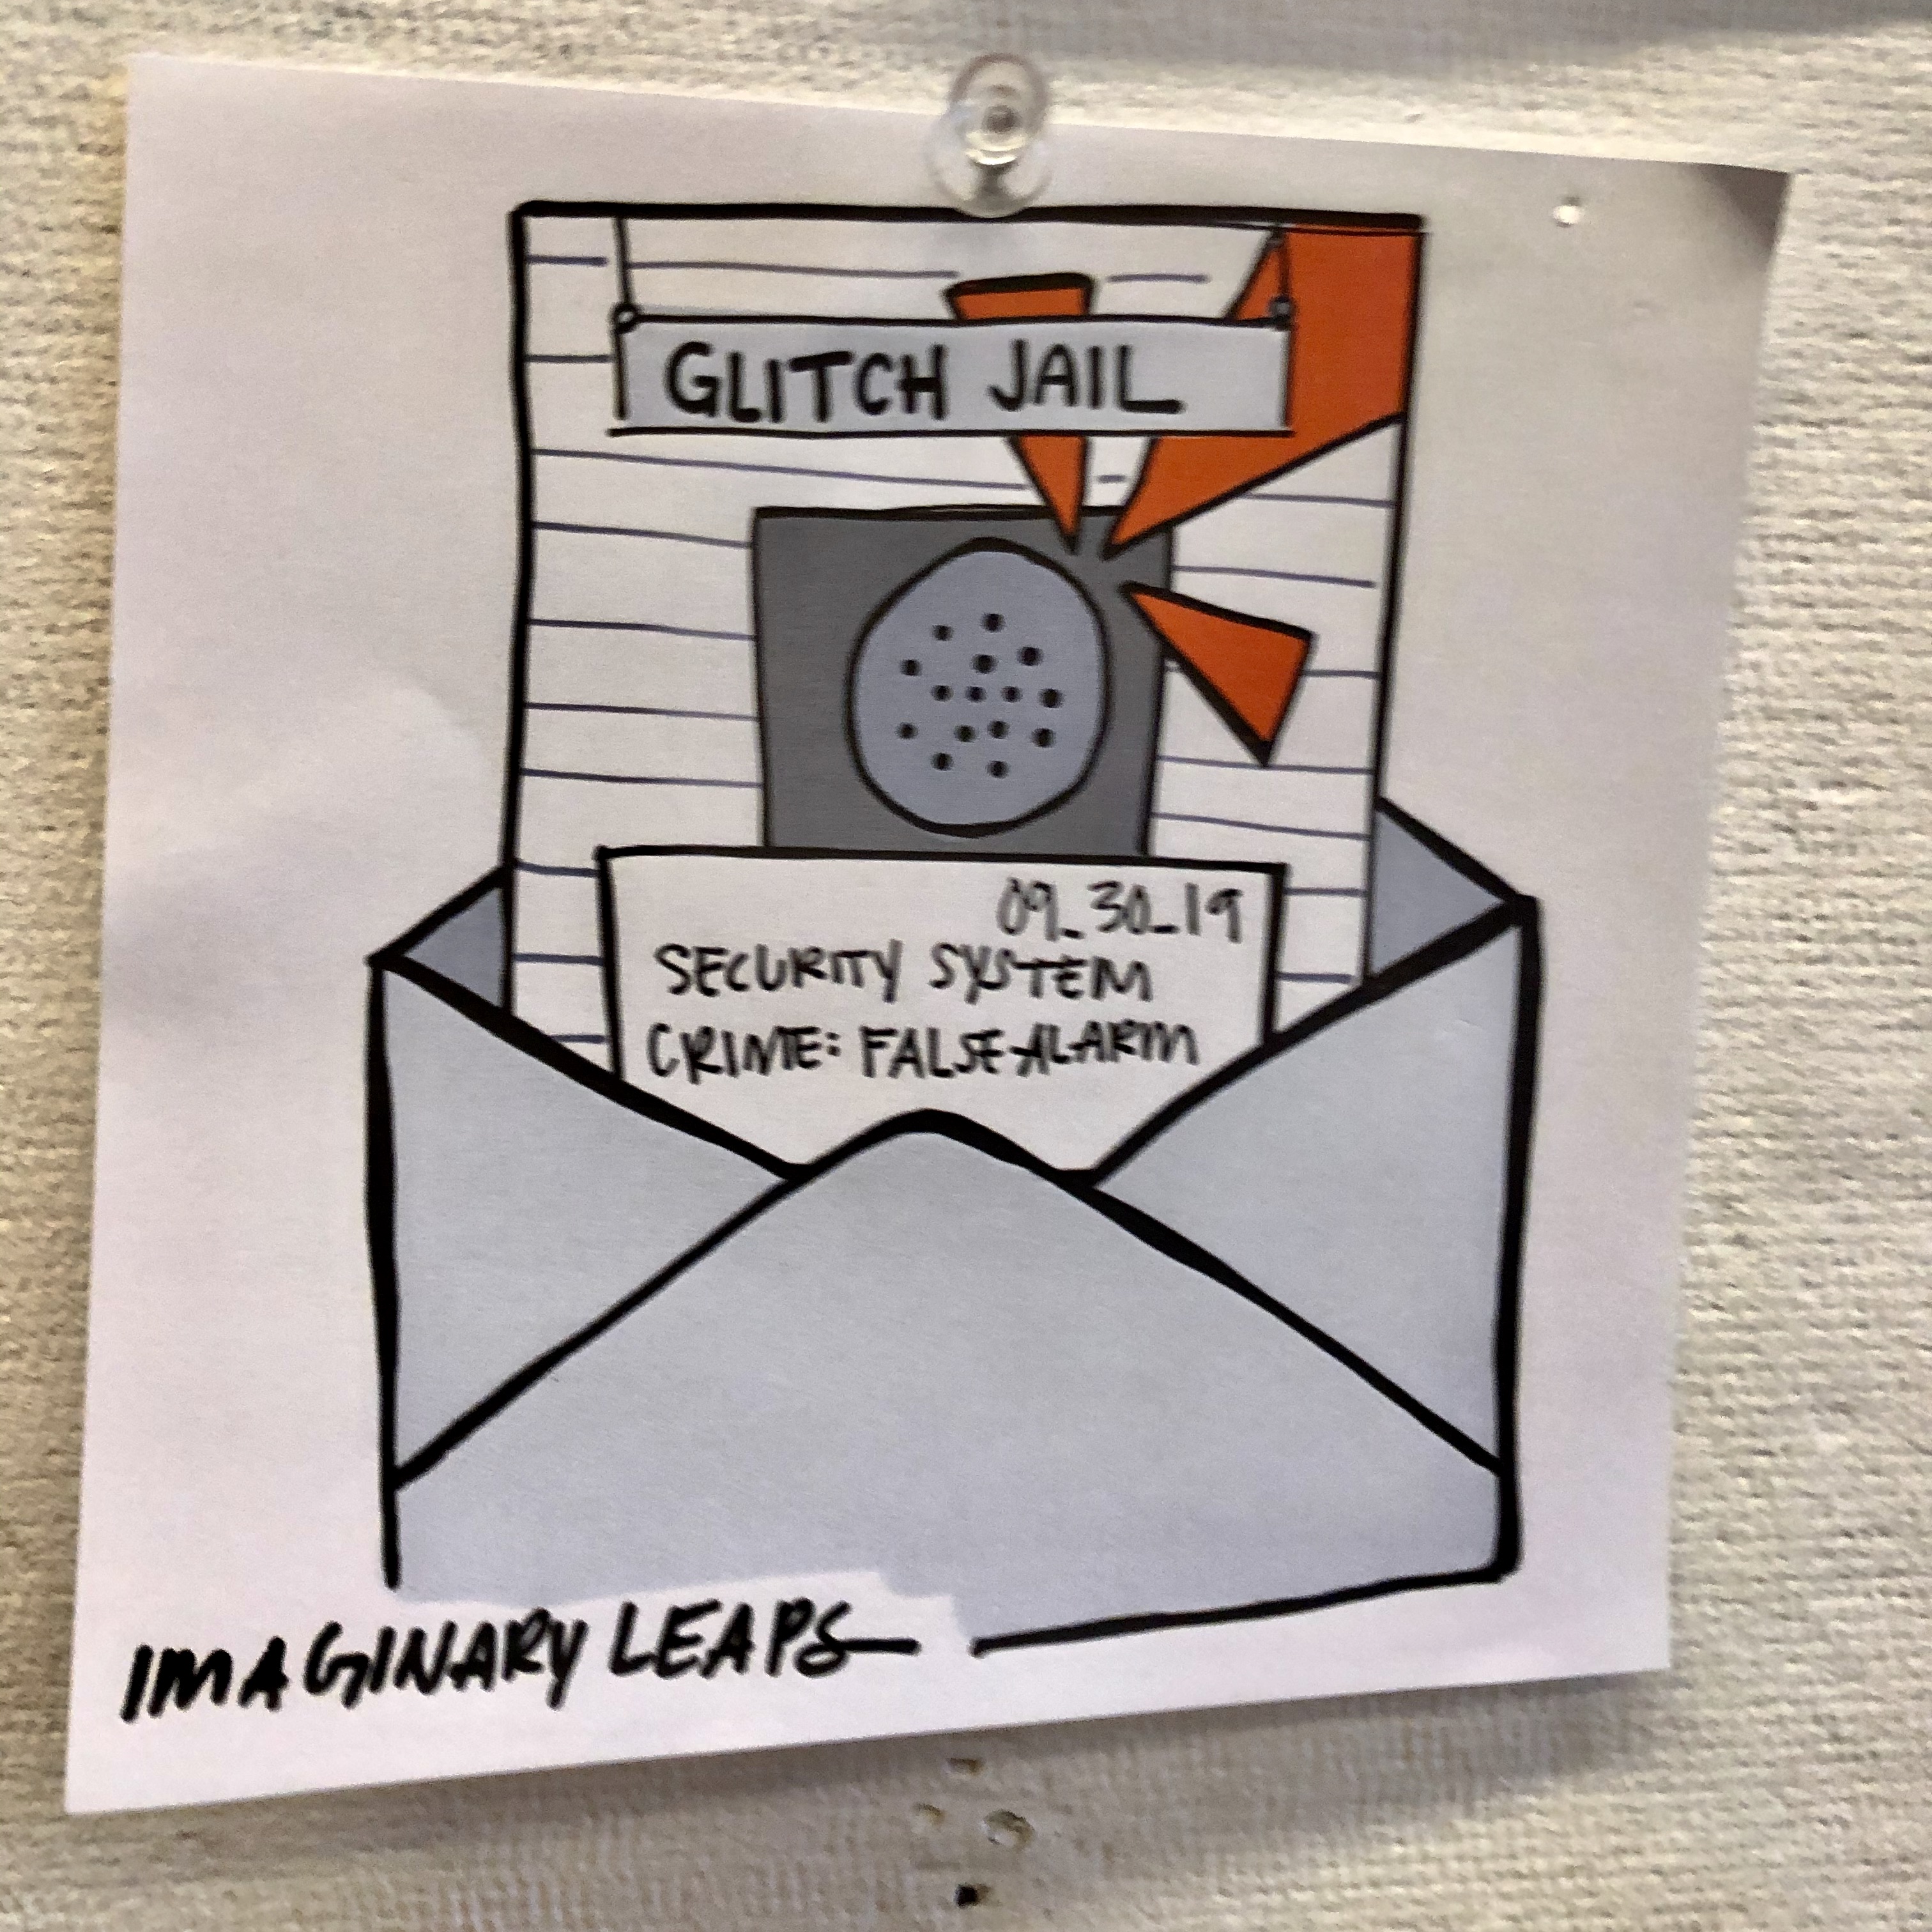
Newspapers are artifacts that have been used to deliver timely information via storytelling. This inspired us to think of an artifact where data was given a voice to narrate its travel and glitch.
Data’s Journey
Where do data go?
We need to understand where do IoT data go, what they do, who they may talk to between the home, neighbors, large tech companies, etc.
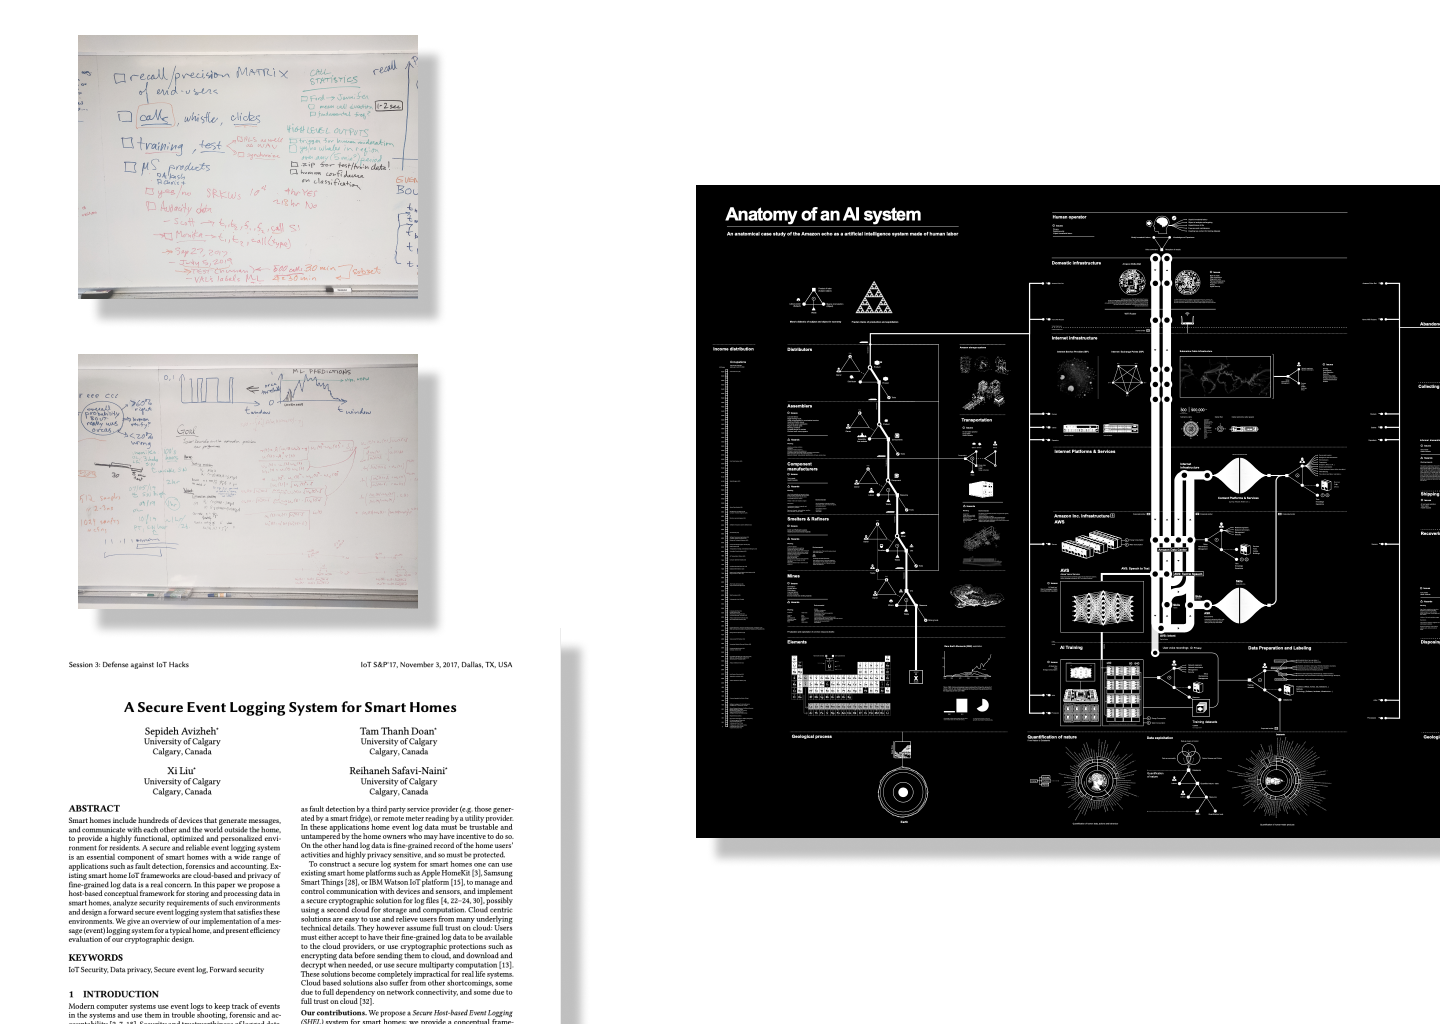 We synthesized and explored different places that data will stop and be stored in the IoT ecosystem.
To understand how data actually travels, we conducted expert interviews and extensive secondary research to understand the ecosystem of IoT data.
Explore Data Narration
Narrate data through storytelling
In order to provoke imagination about data’s journey as imaginary leaps, we first tried to explore ways to curate different ways to narrate data through storytelling.
Draft Data Narratives

We ideated around receipt design to provoke the imagination of data’s activity at different locations.
One of our designs is to design abstract maps that map out router locations, and home dwellers can learn more about different types of data’s activity by decoding symbols on the map.
Evaluate Narratives
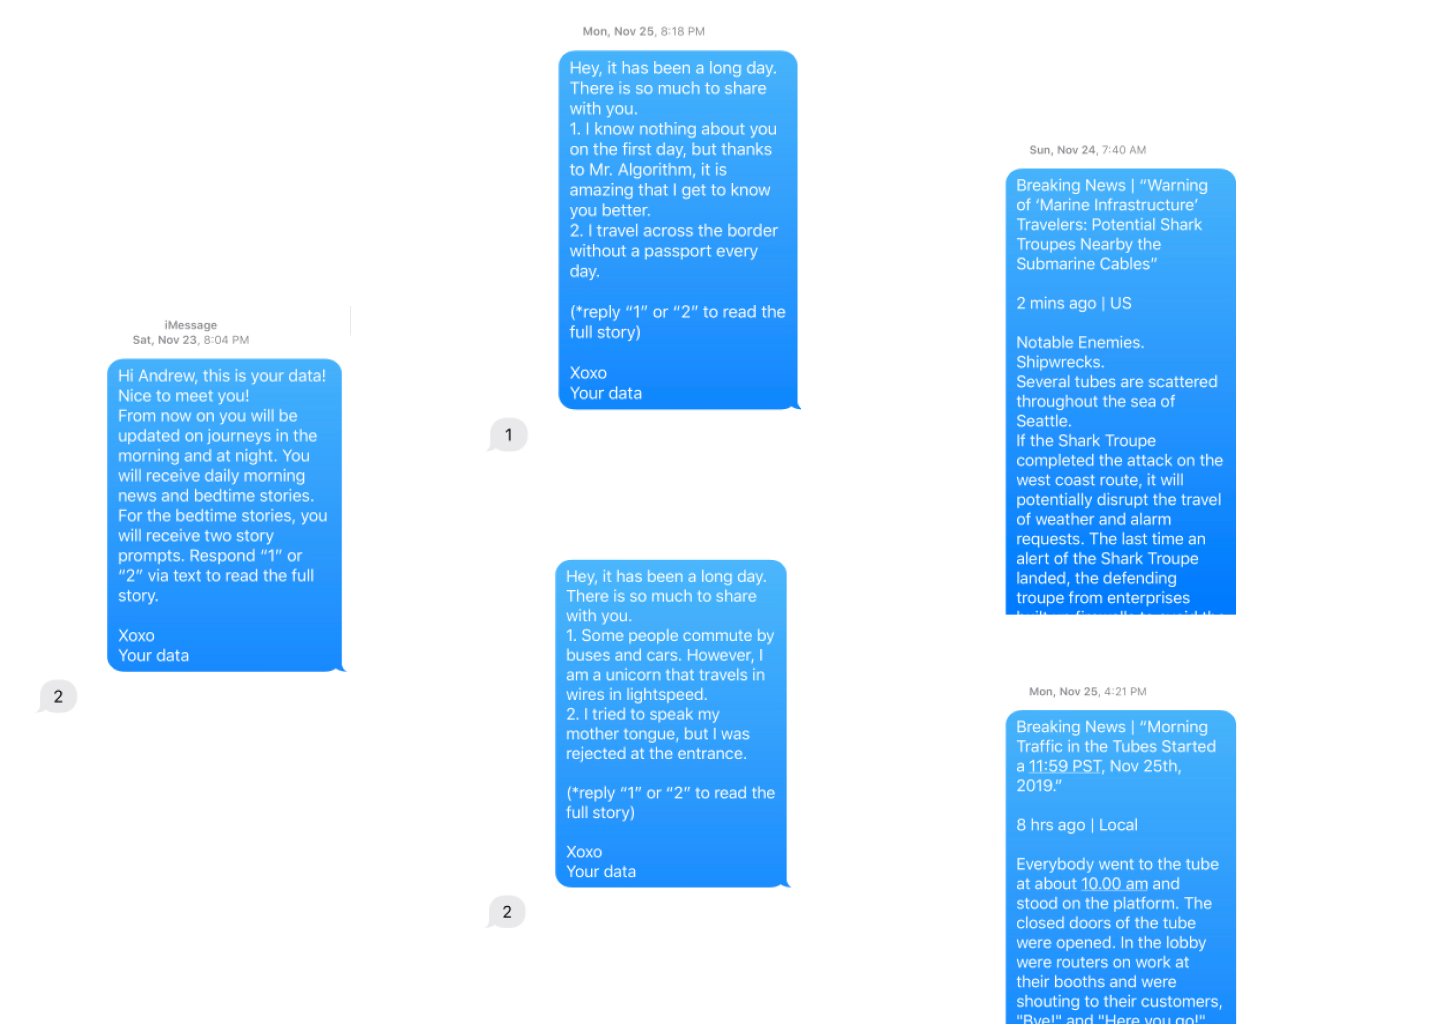 We sent daily data bedtime stories and data news in the first-person narrative as data via text anonymously.
We designed testing activities with four participants with different levels of understanding of data.
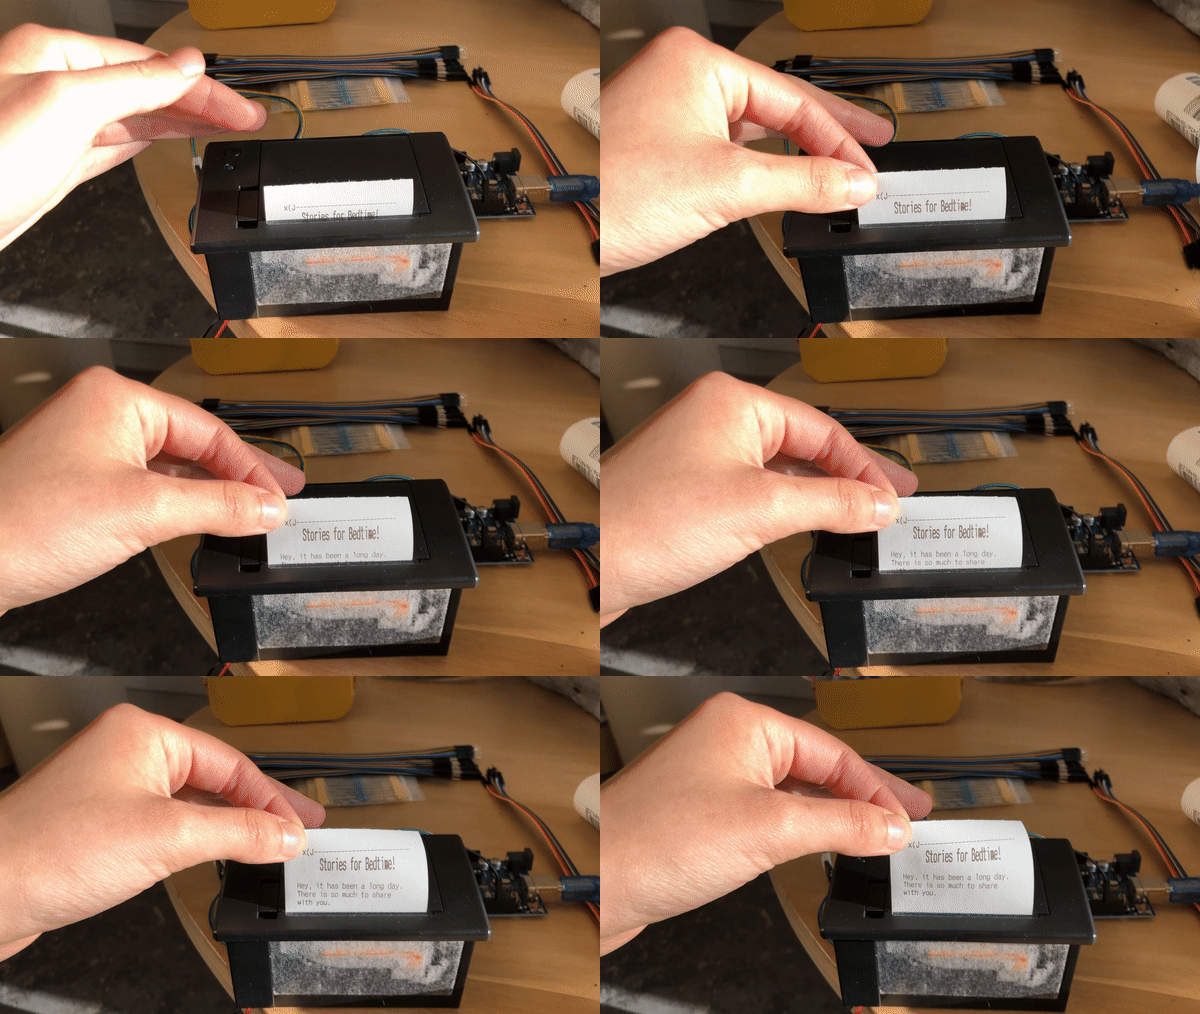
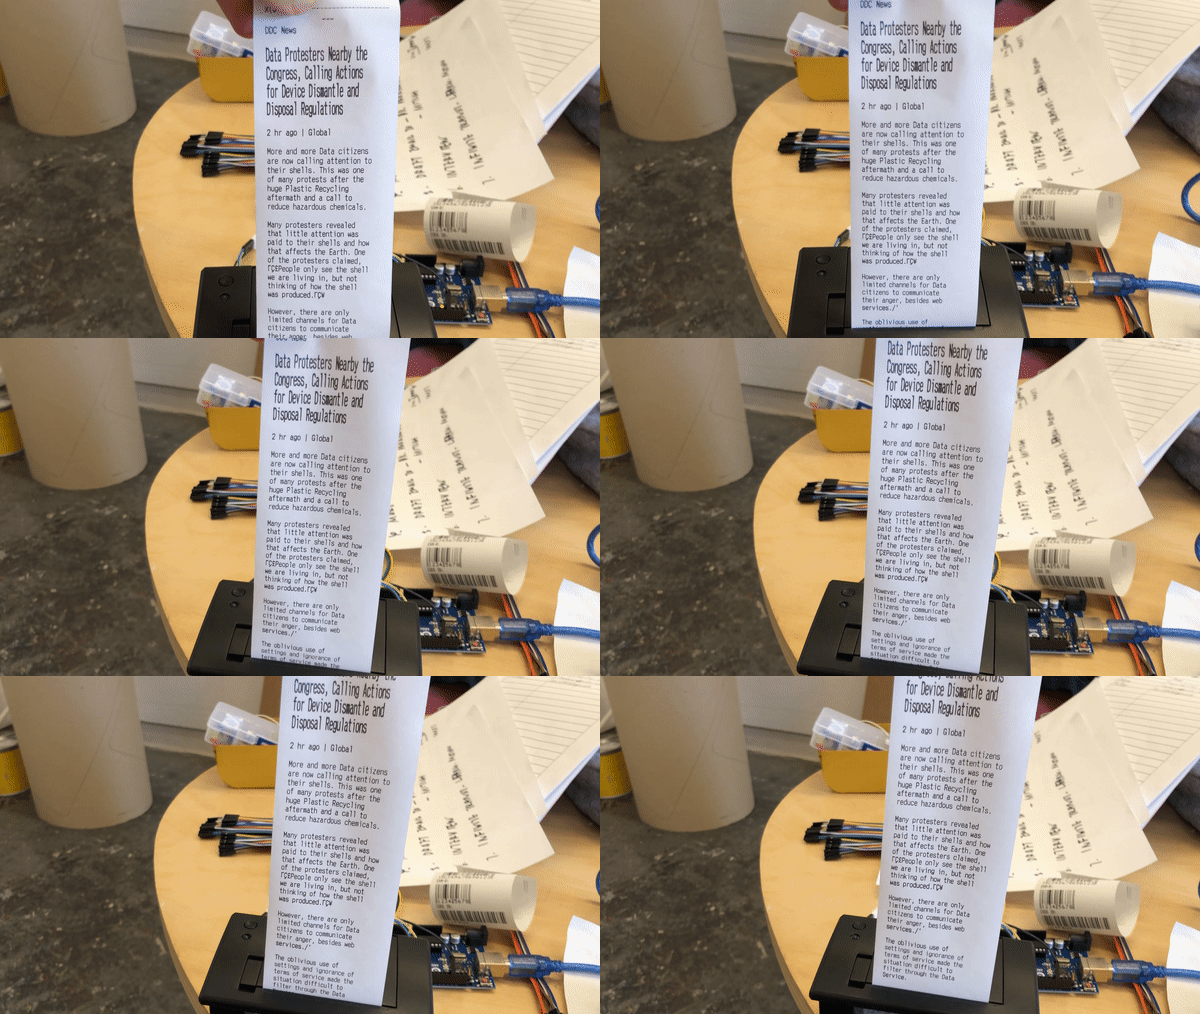 I prototyped a thermal printer that prints out receipts of data’s mad libs stories and corresponding keys during the interview spontaneously. Observing participants' thought process in decoding and reflection helped us to recognize the barriers of storytelling on receipt in provoking imagination.
We also conducted a Wizard of Oz testings with each participant individually. It helped us to better understand the limitation of storytelling, and the importance of sustaining interest and engagement with the artifact. It also probed us to think about different personas of home dwellers in different family sizes.
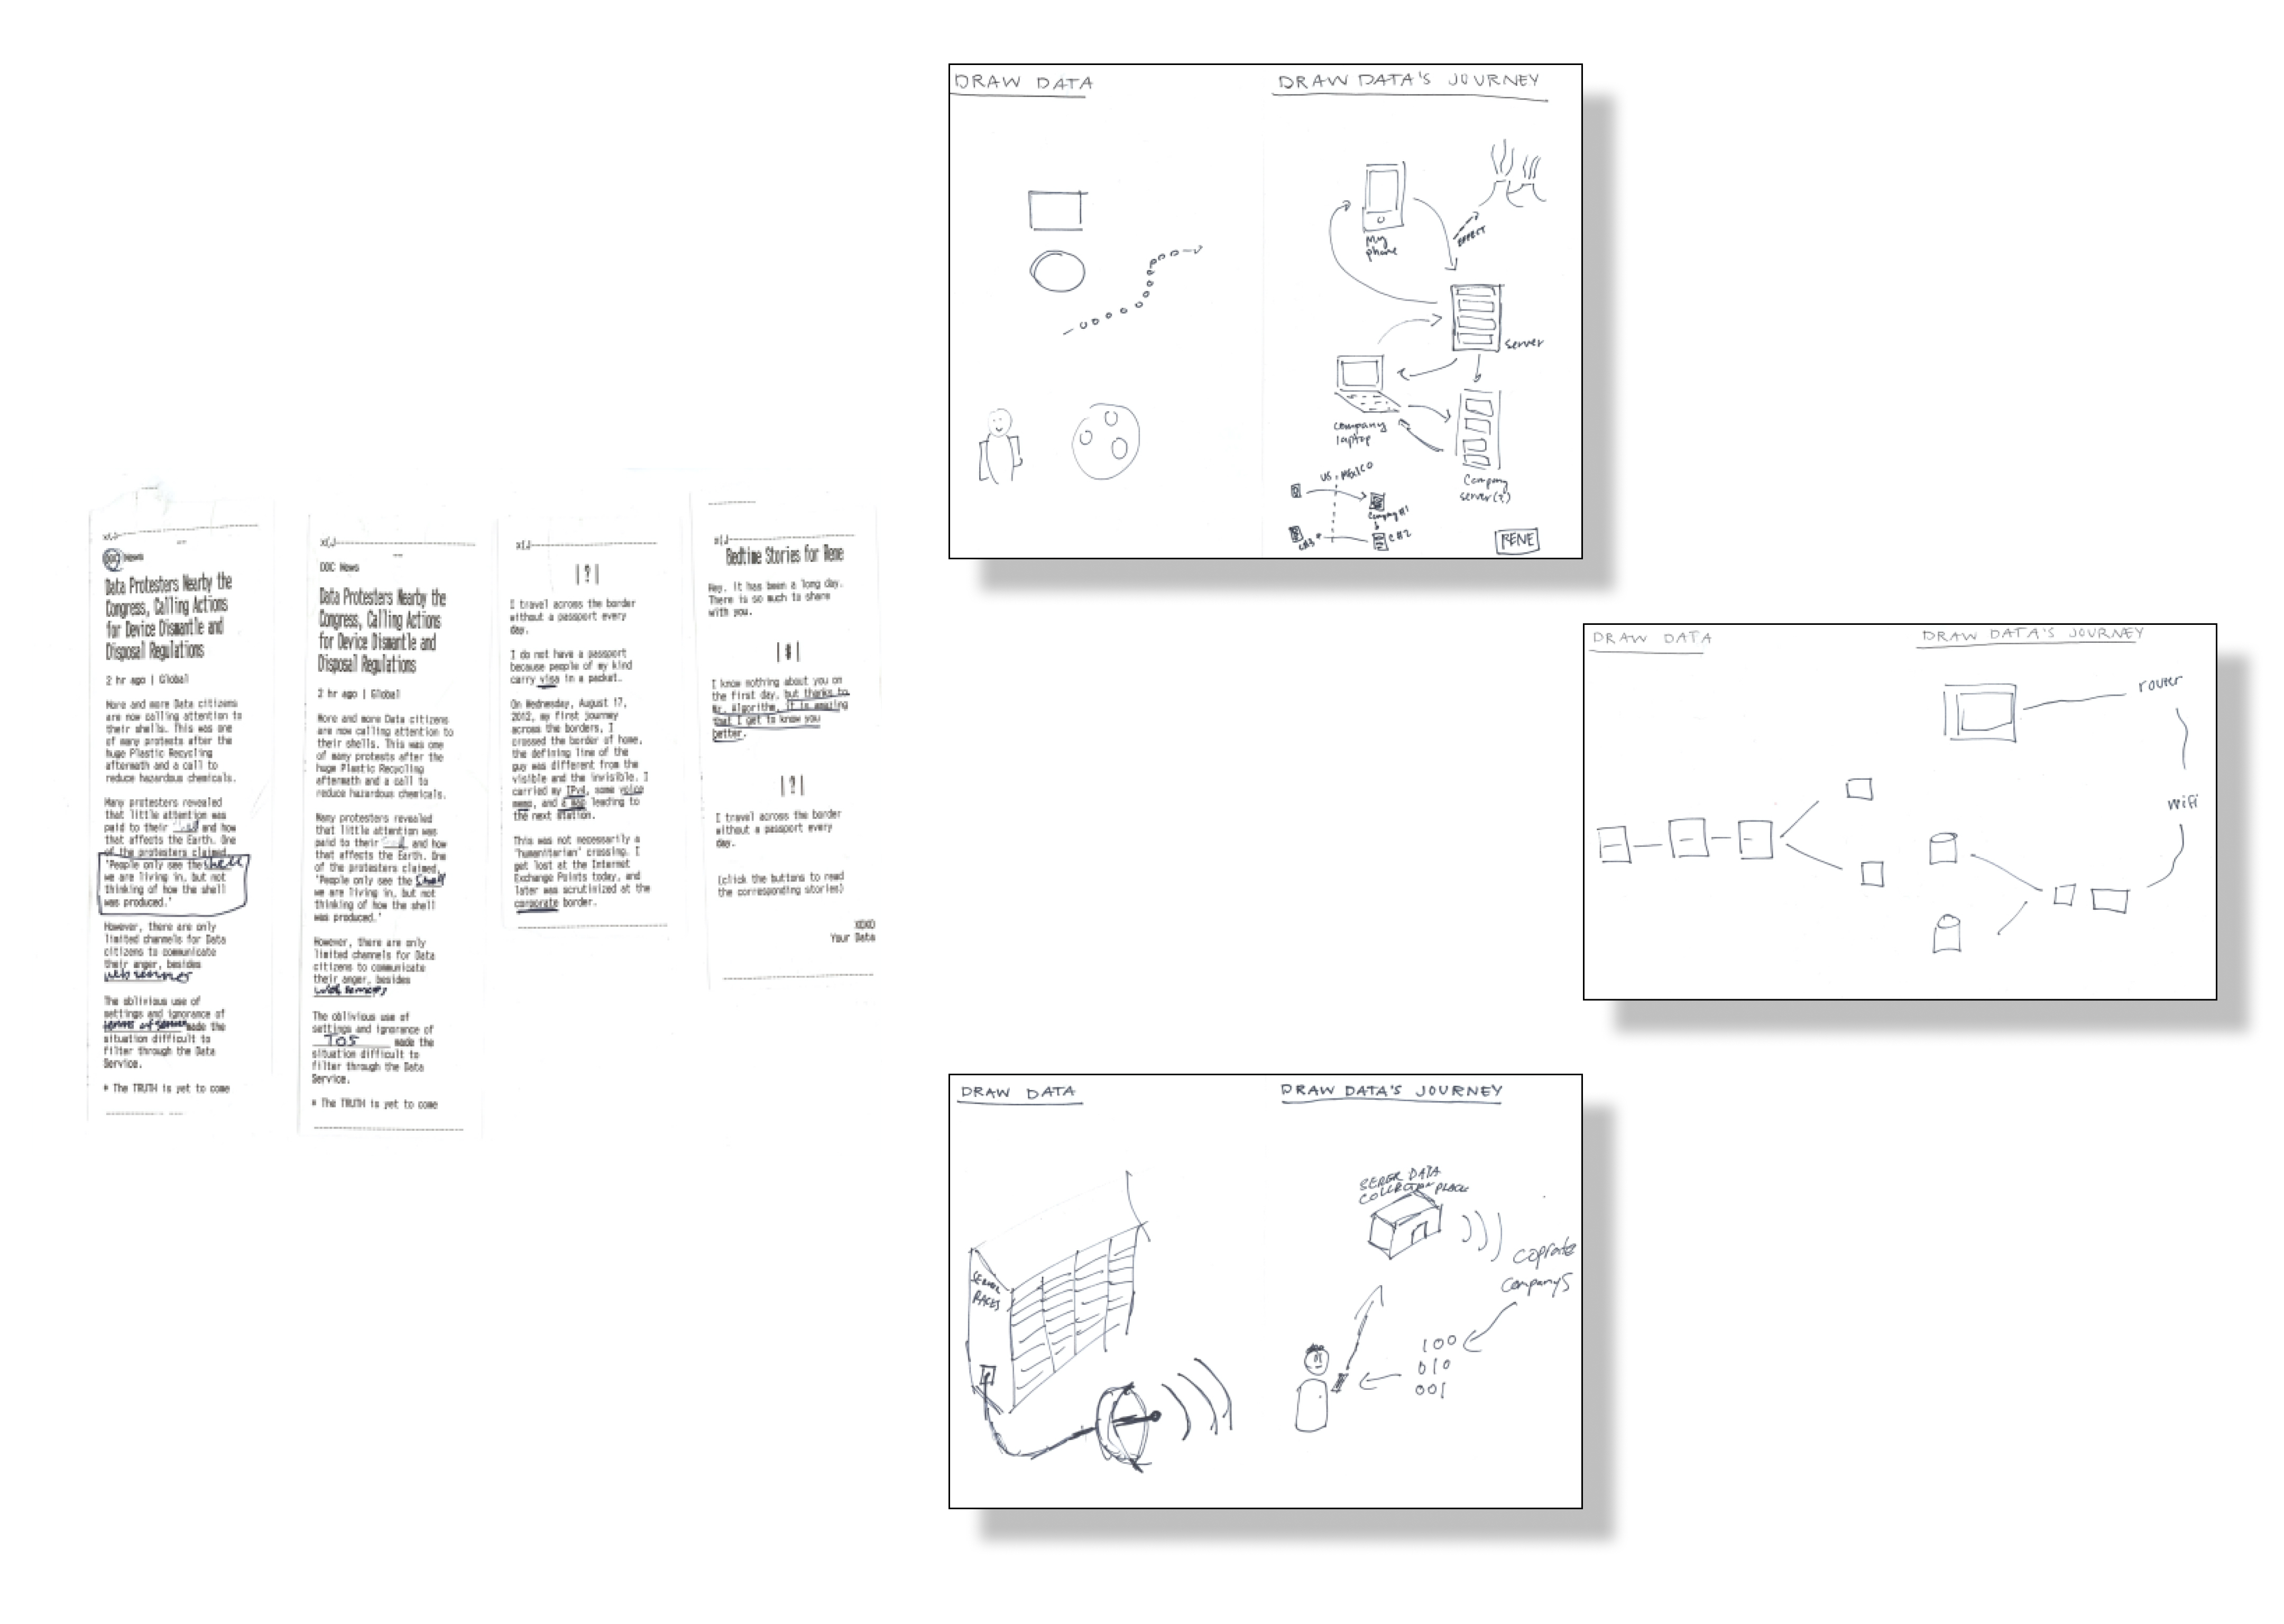
Illustration of participants’ understanding of data’s journey, and artifacts of decoded data’s message by participants.
We realized that storytelling gives data too much character that biases the narrative. Meanwhile, people relate these stories to other unrelated real-world events that deviate from data’s encounter on the journey.
Sound is a rich format that provokes imagination.
Define Data’s Voice
Data’s narrative through sound design
In order to define the voice of data, we need to further define our stance on data narrative as researchers, as well as finding alternative ways other than stories to anchor data’s narrative.
Clarify Research Stance
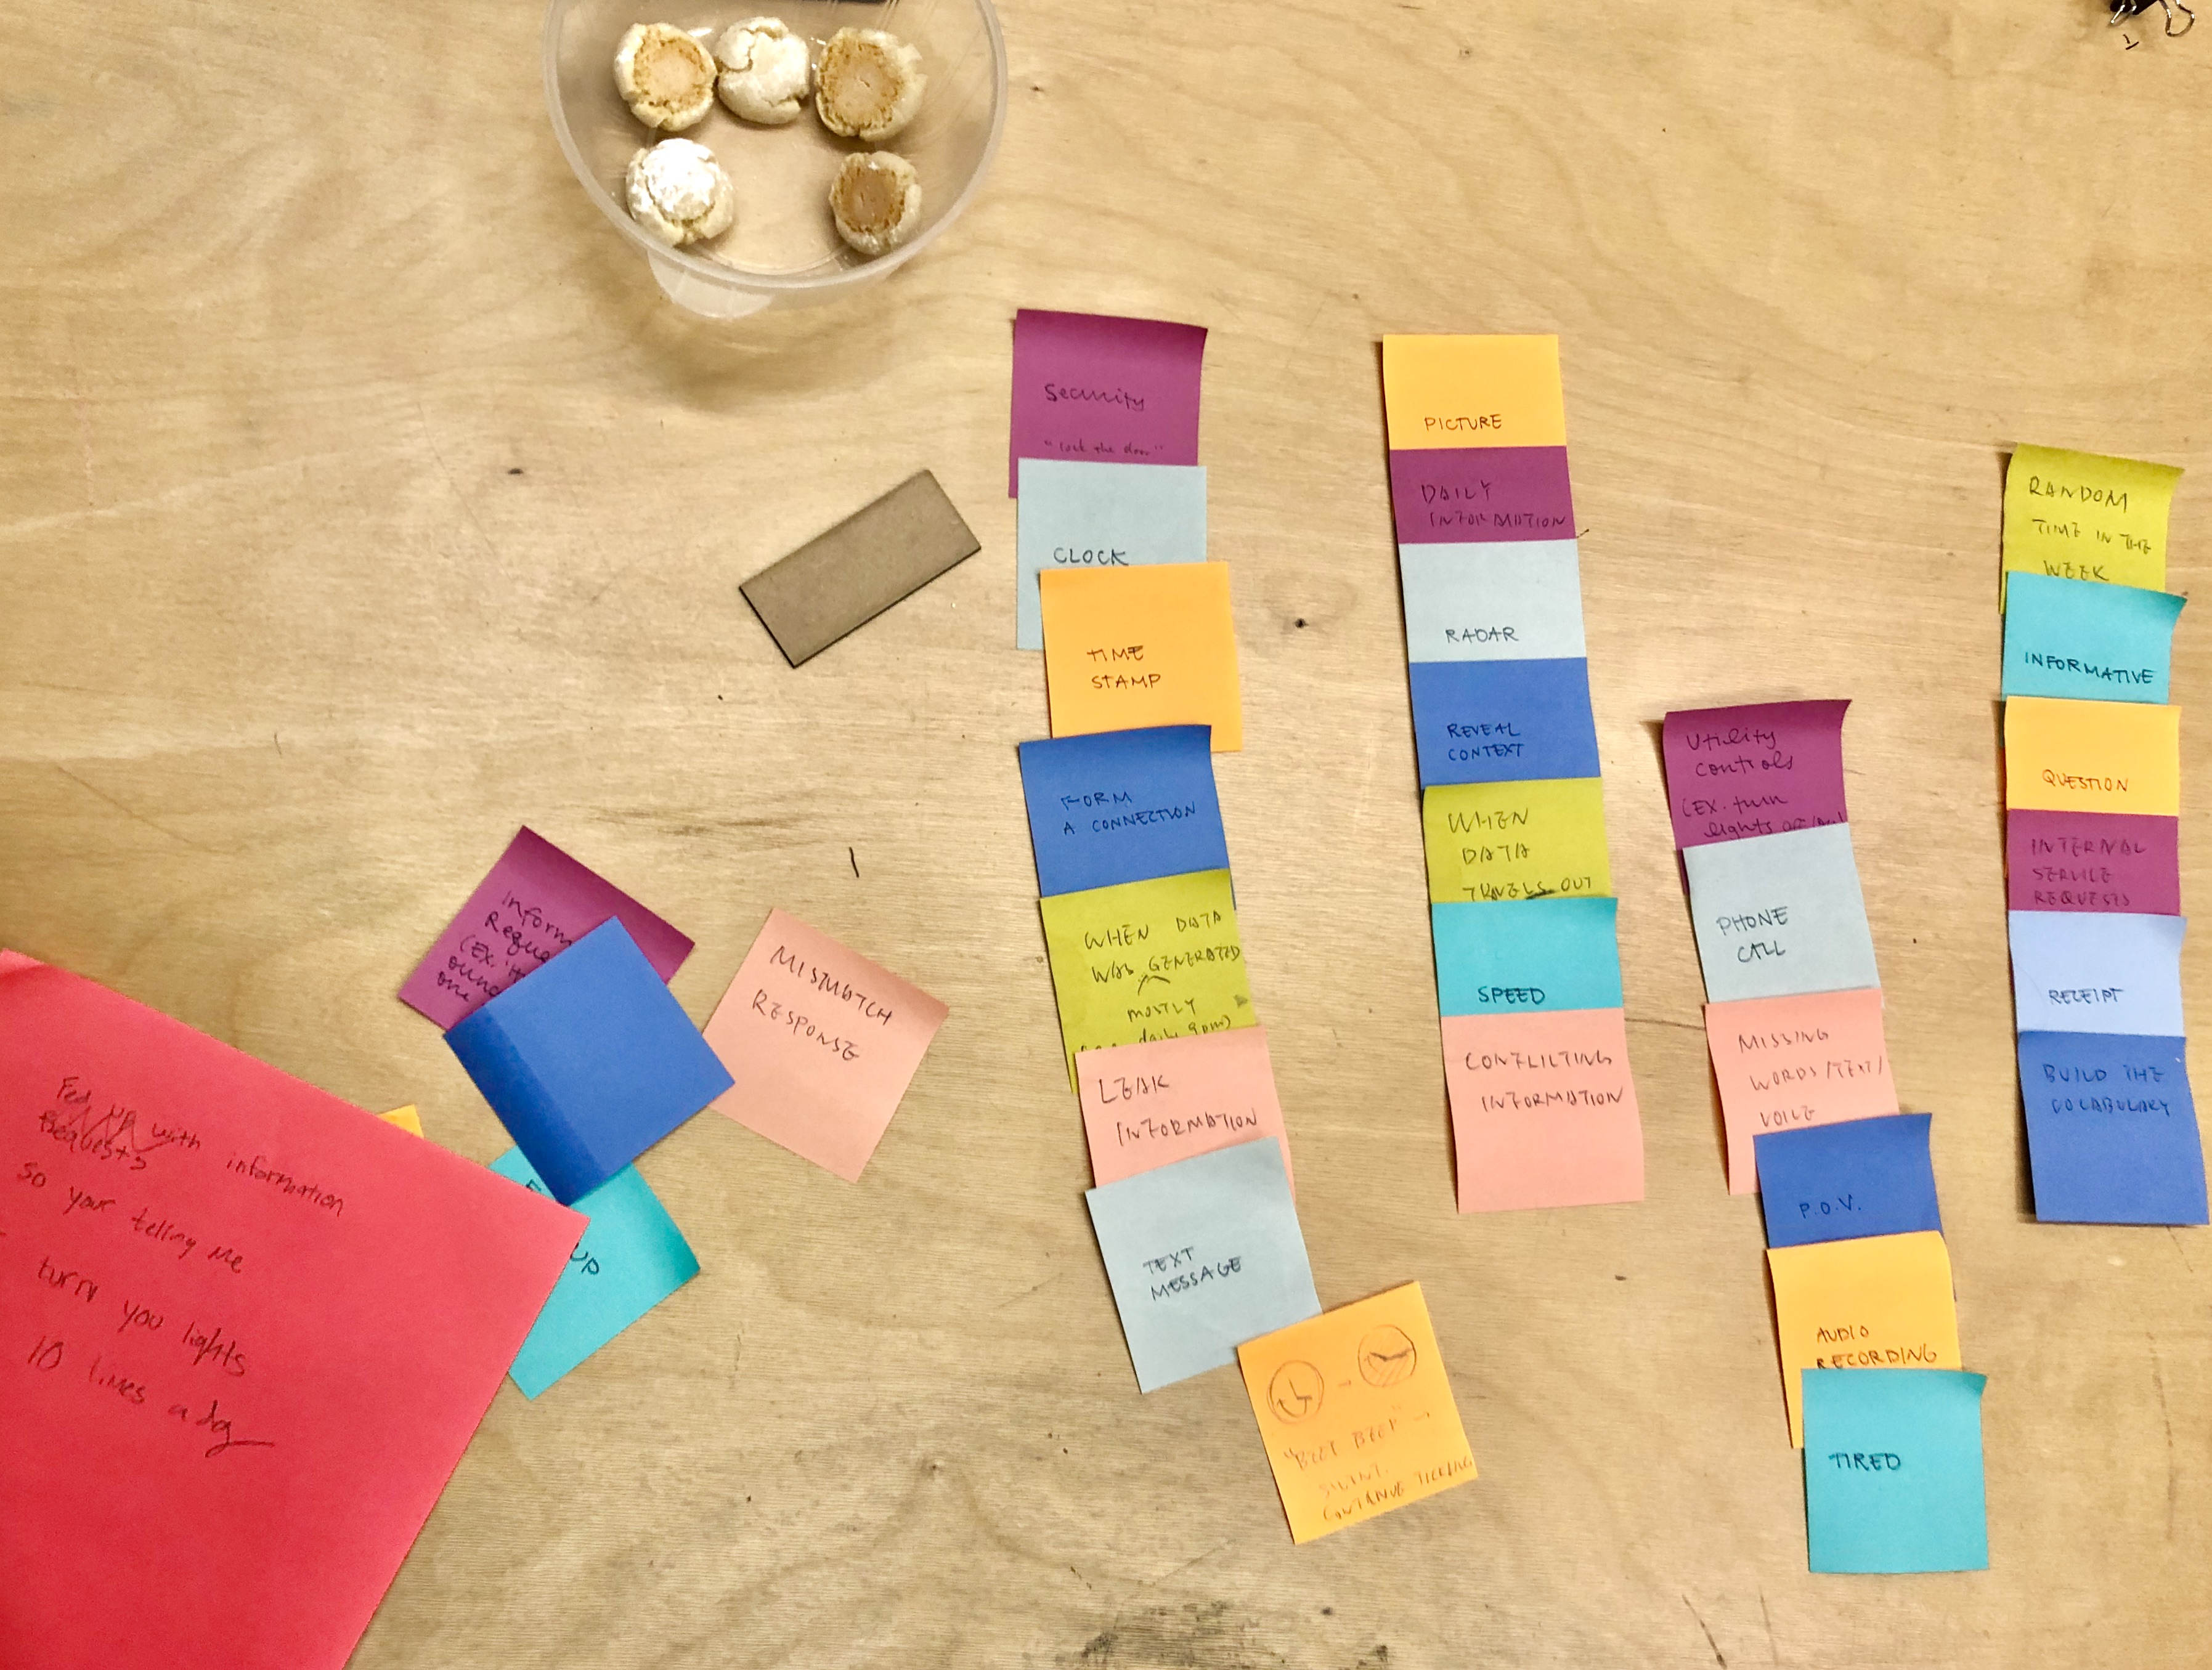 We designed a “data buffet” activity of different kinds of data and data presentations. These activities helped us define our stance as researchers on human data encounters as critical, yet generative; surprising, yet relatable; out there, yet relevant; computational, yet physical, material, and embodied; specific, yet extensible, thorough, yet open-minded.
To communicate clearer intentions, we hosted an open story sharing and discussion within the research group to restate our research stance: data should be represented as objective bits and bites without intentions, described as “they” not “it”.
Concept Development: Broadcast
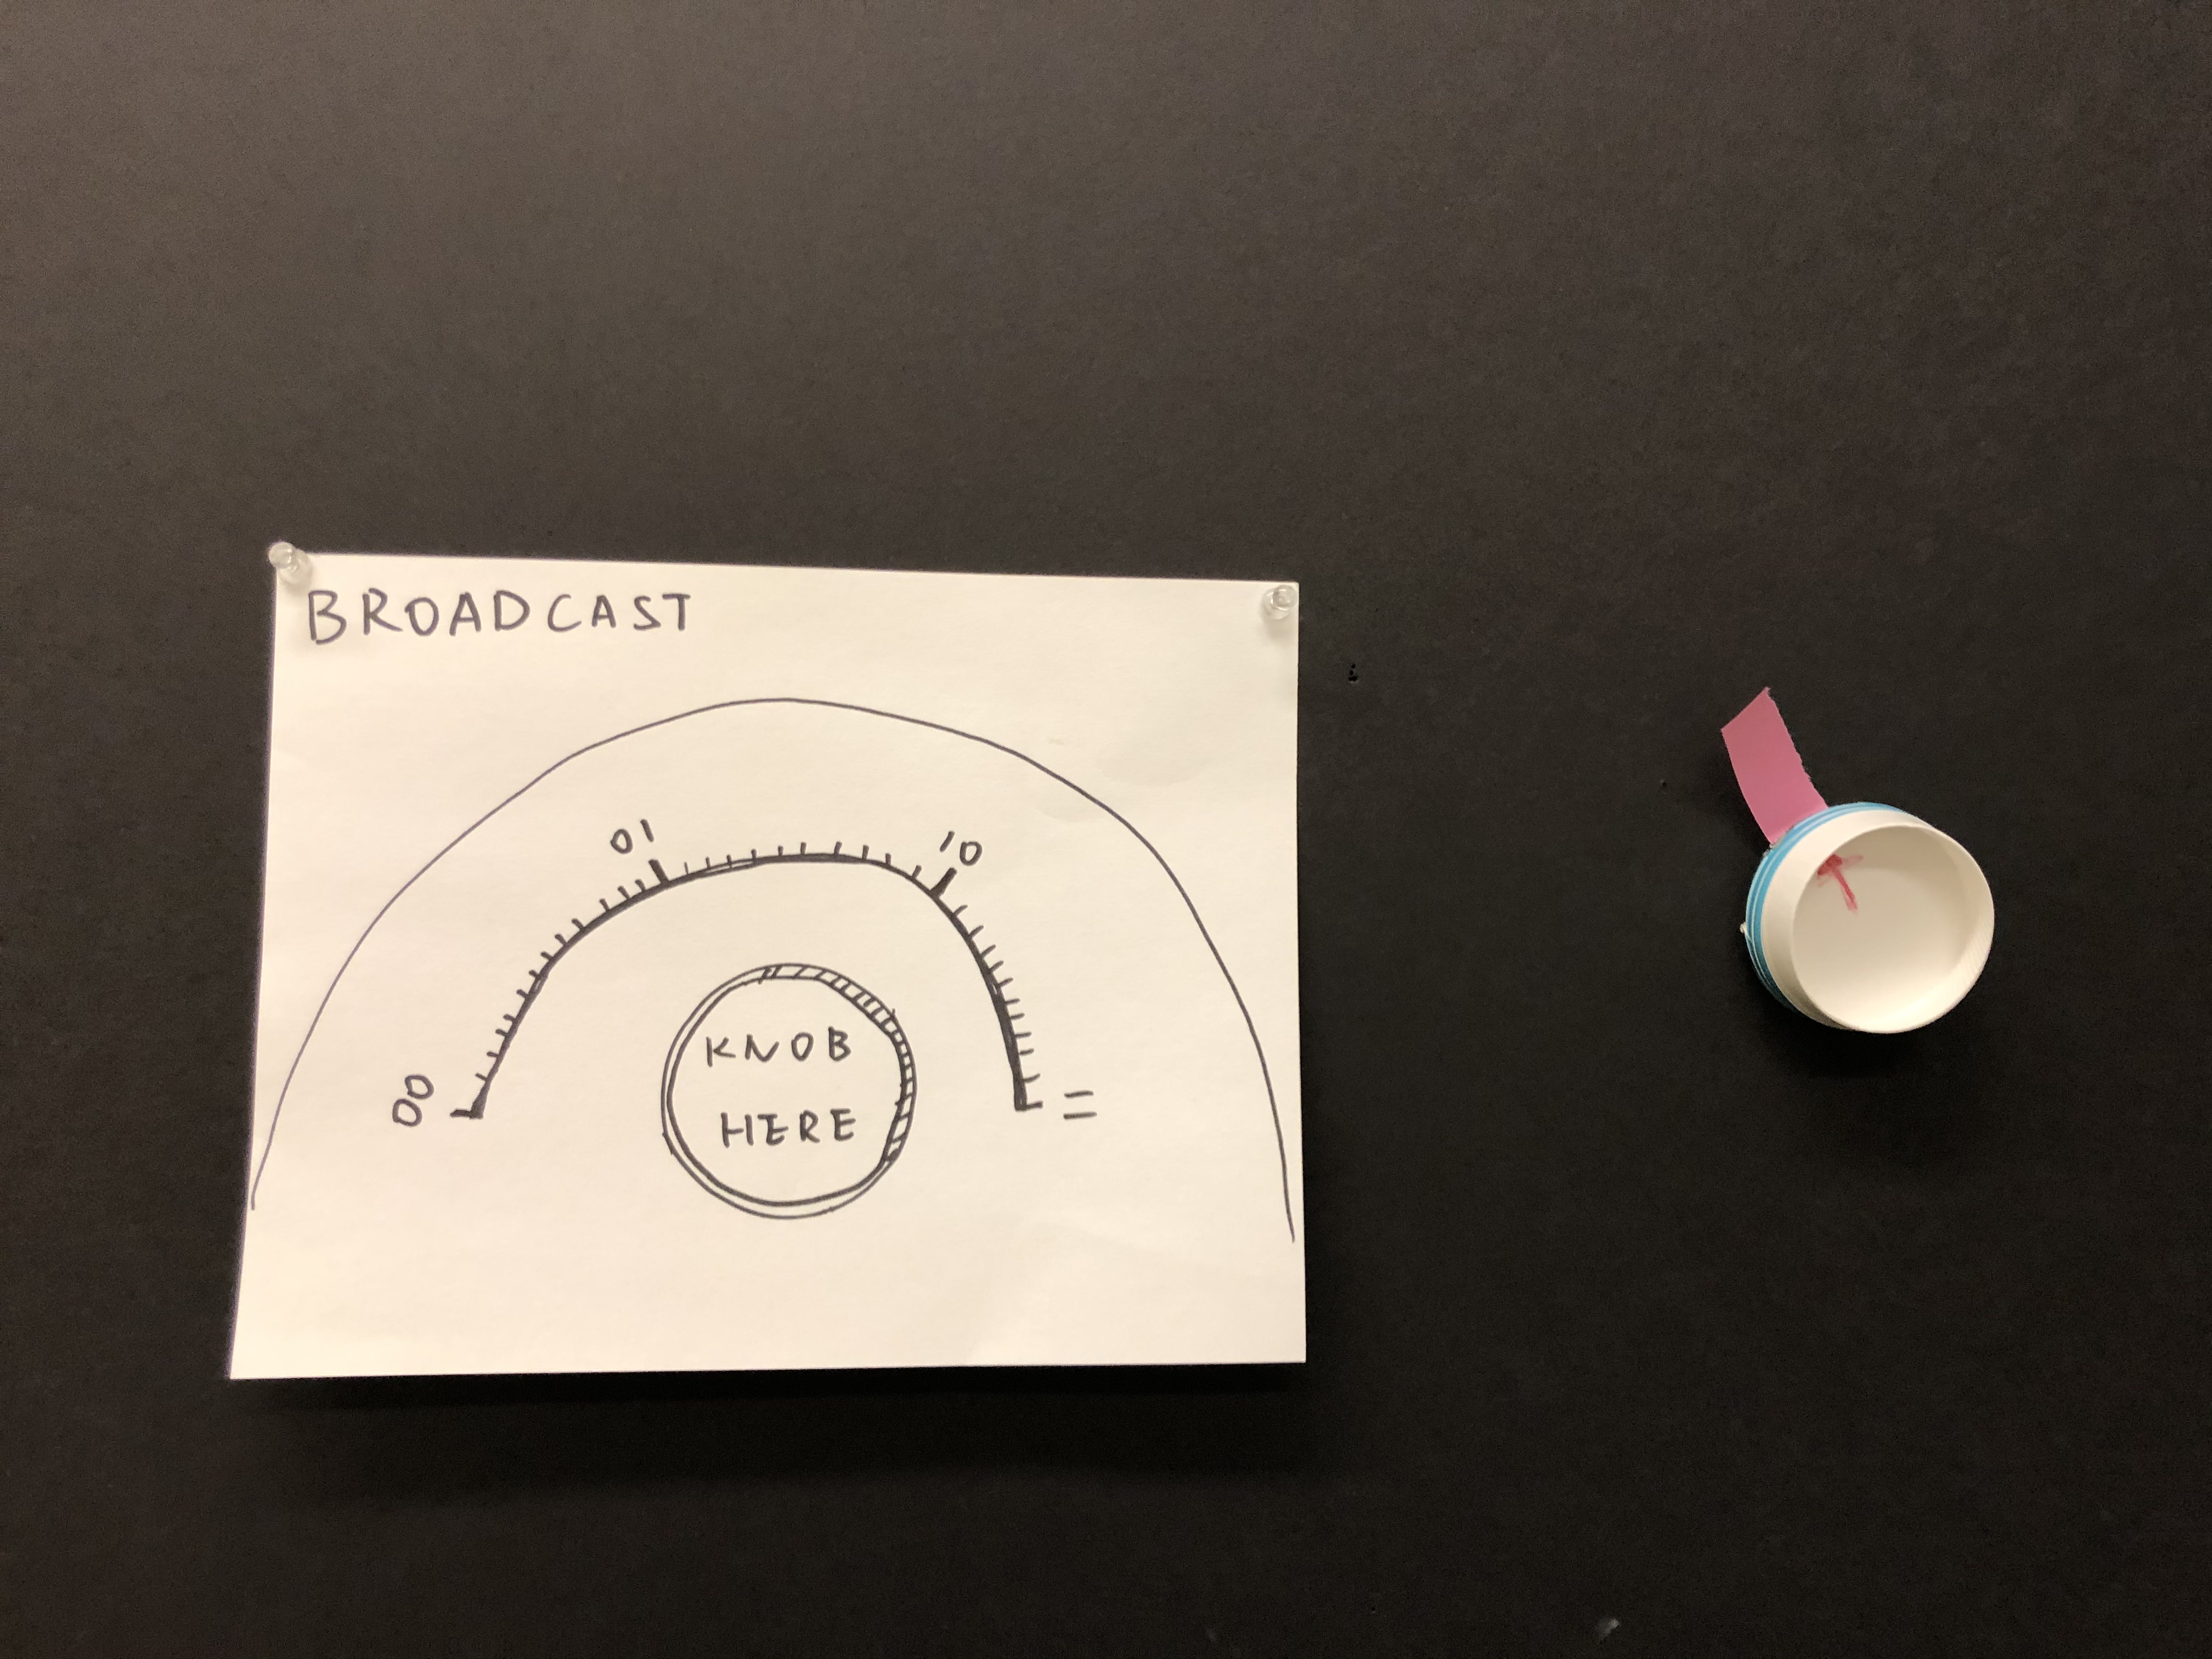
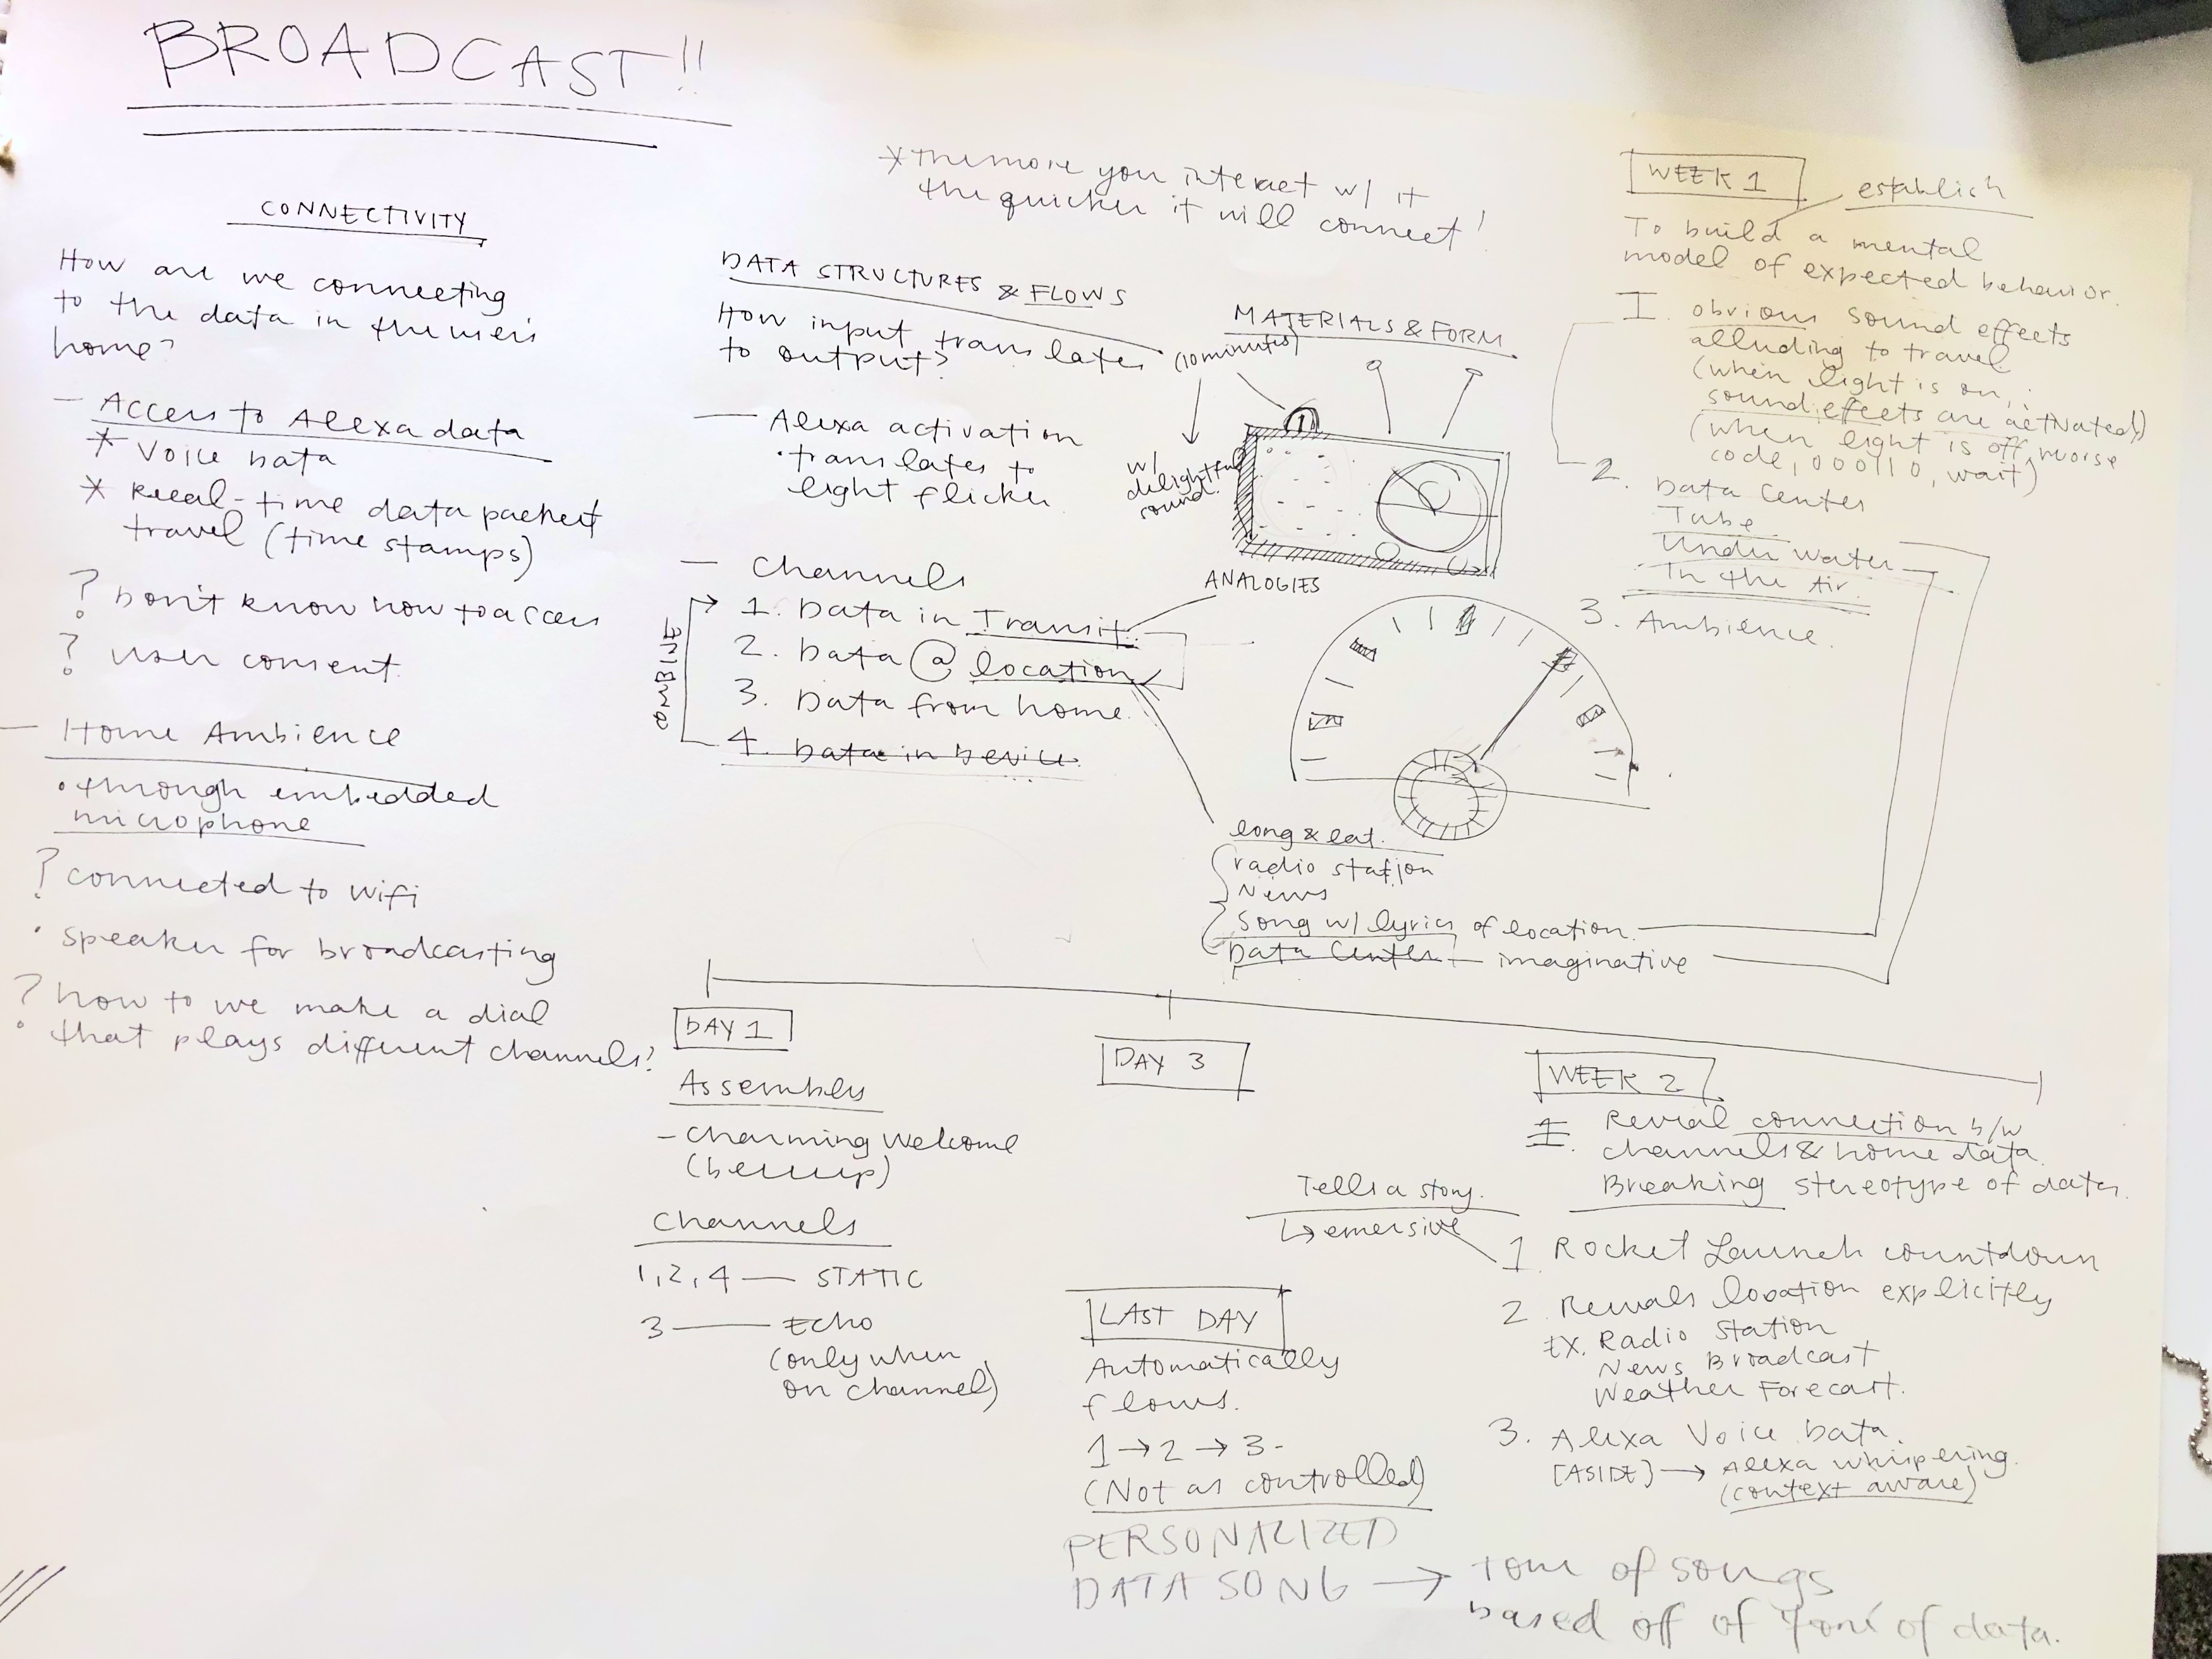
We gained insight into the diversity of households living with data, and the richness in sound that can present information. The working prototype helped us to further define the two-week user journey of home experience with IoT data.
I lead the prototyping for this experience with Arduino and Processing.
Investigate Data Capture
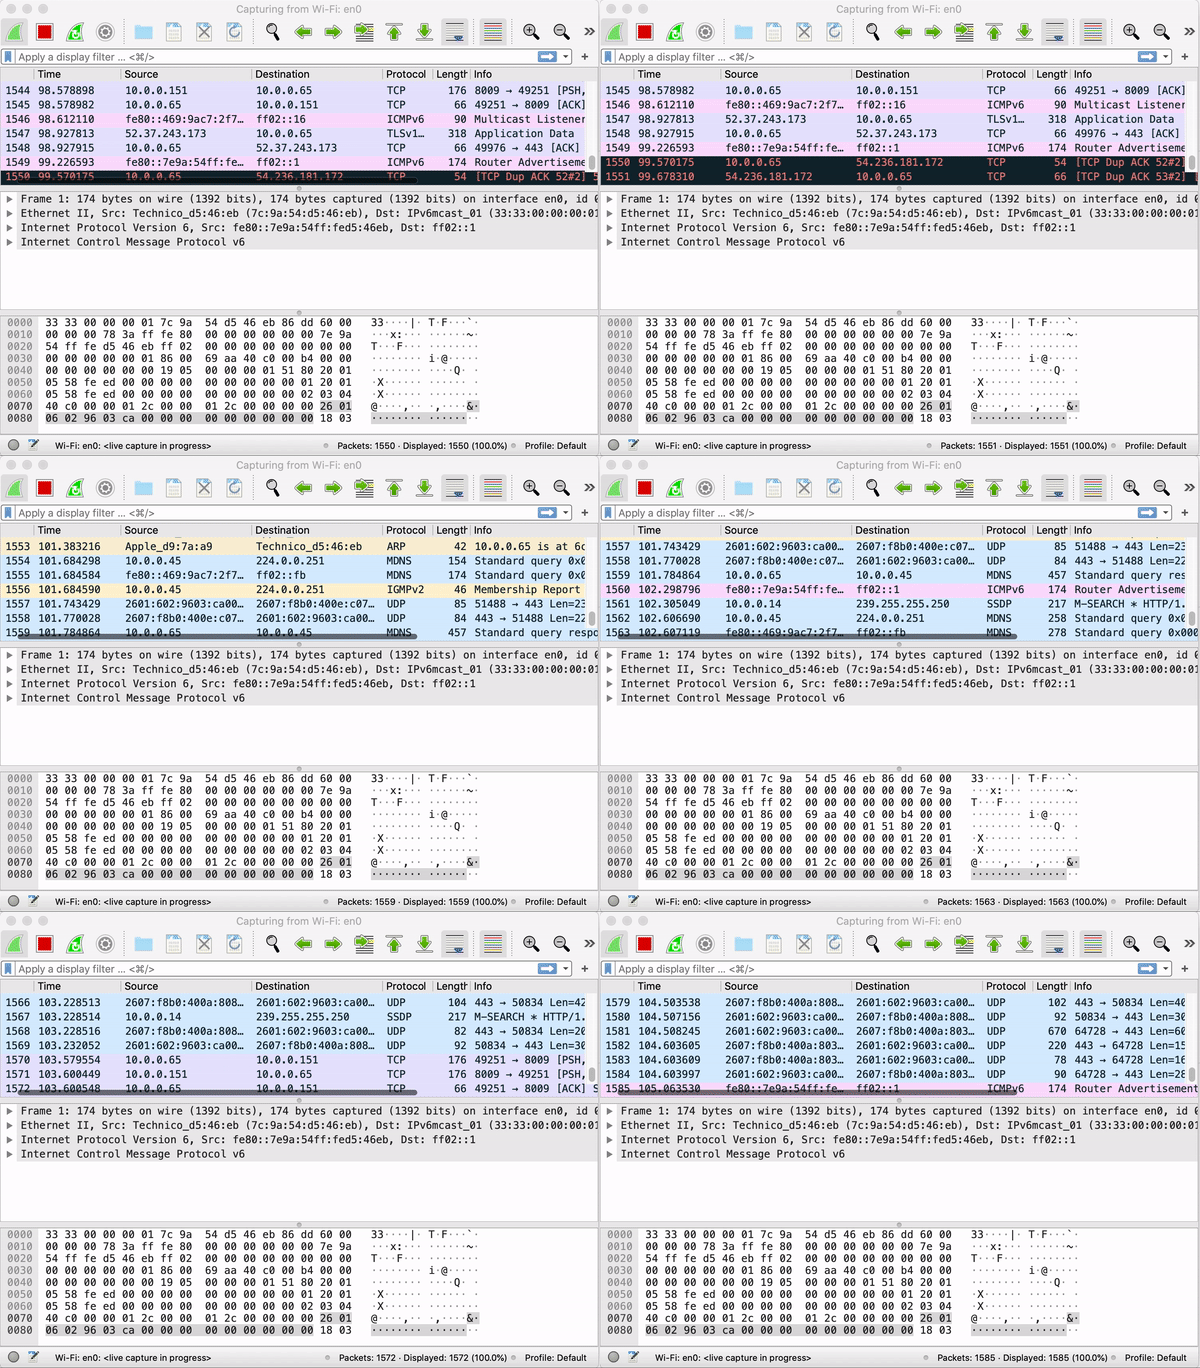

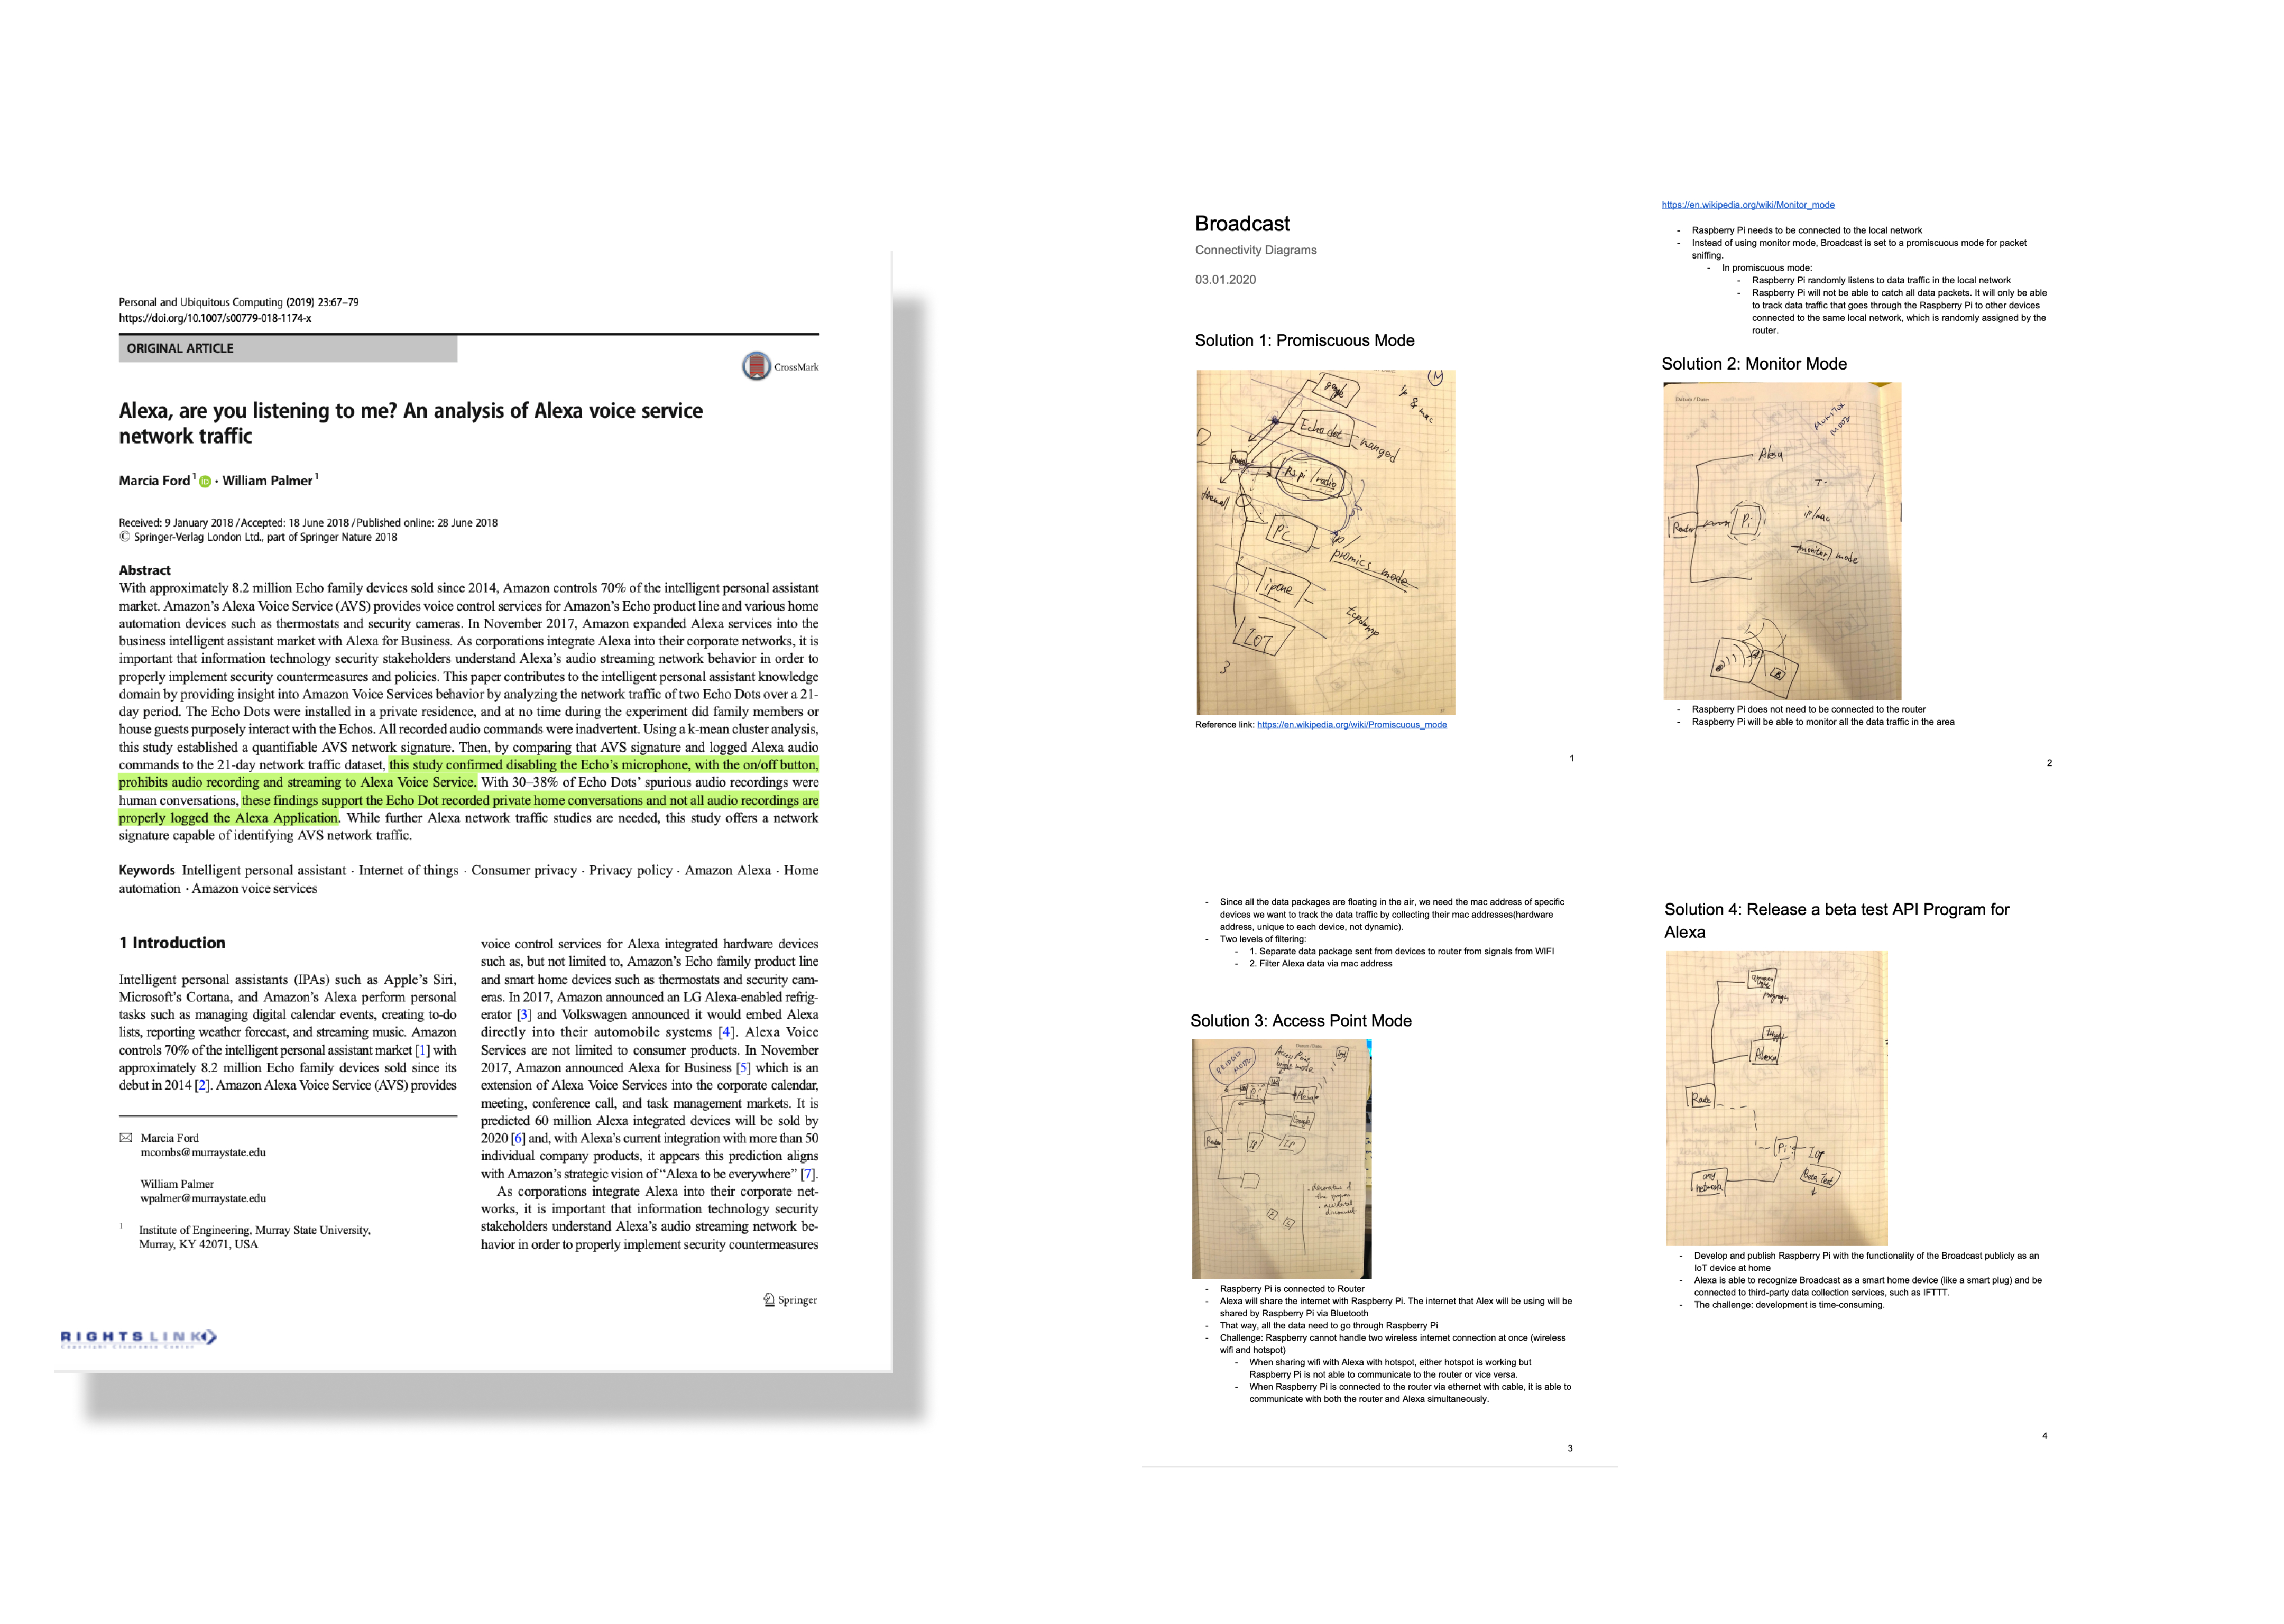
I used WireShark to capture data in my place, and the potential solution to capture data at home from the Router by looking into academic research papers. This hands-on experience gives me a deeper understanding of data capture, which helps my collaboration with the engineer later on.
I lead the investigation on the feasibility to capture home IoT data, specifically finding feasible communication solutions that can be implemented within the research timeline of 3 months.
Sound Design
We mapped out data’s journey in a 14-day home deployment.
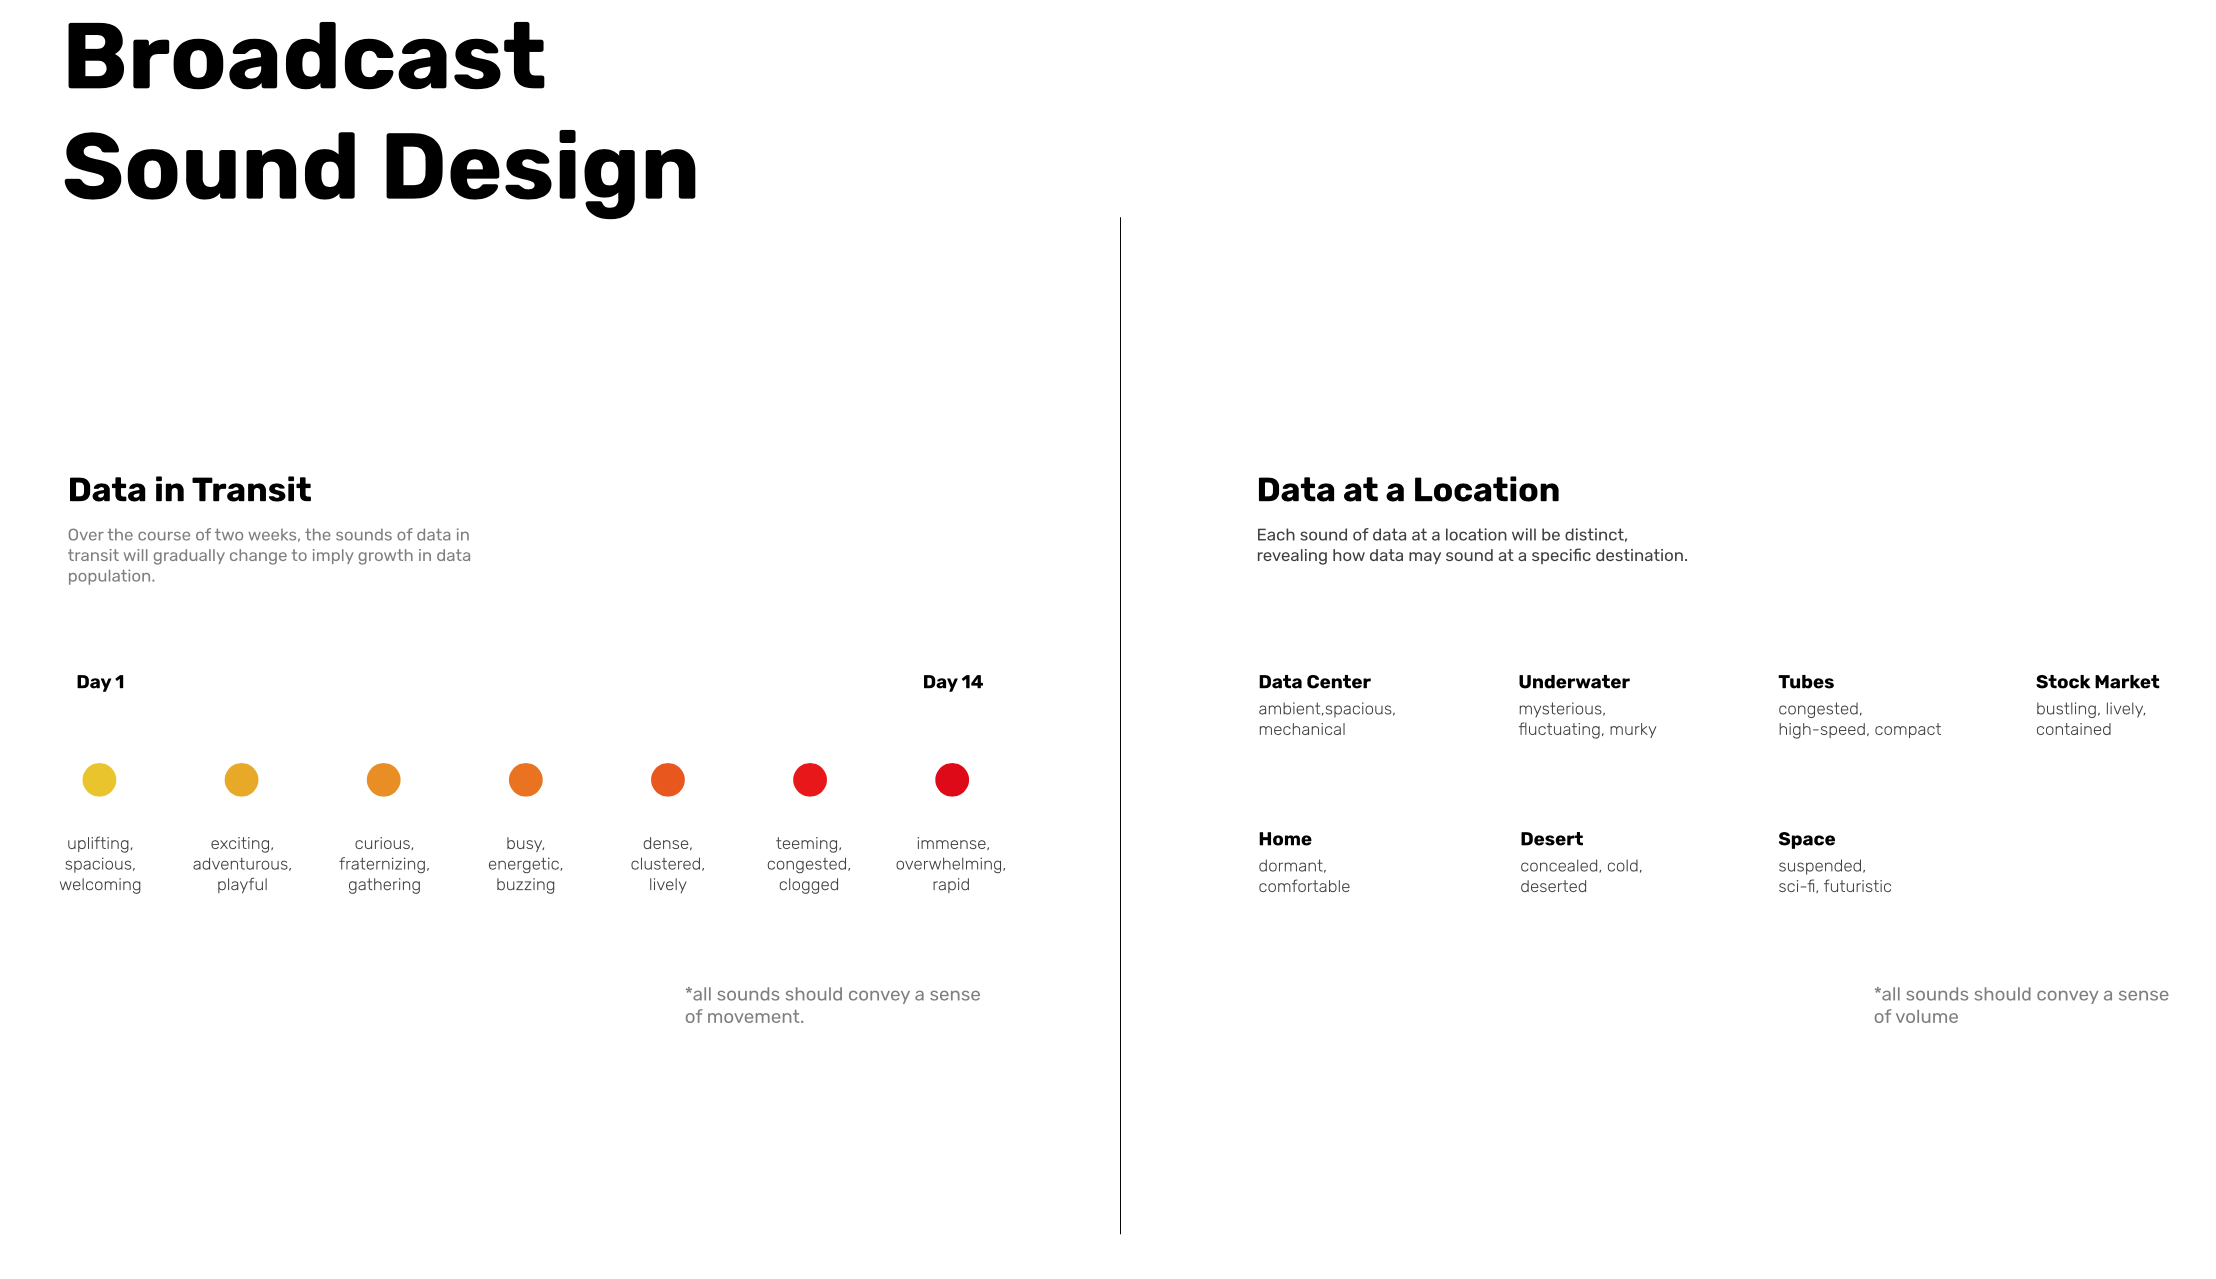
Sound Design spec doc of Broadcast sound evolving over 14-days co-live with participants.
We worked with a sound designer to produce sounds that represent “data at the place” and
“data in transit”.
“data in transit”.
Prototype Interaction
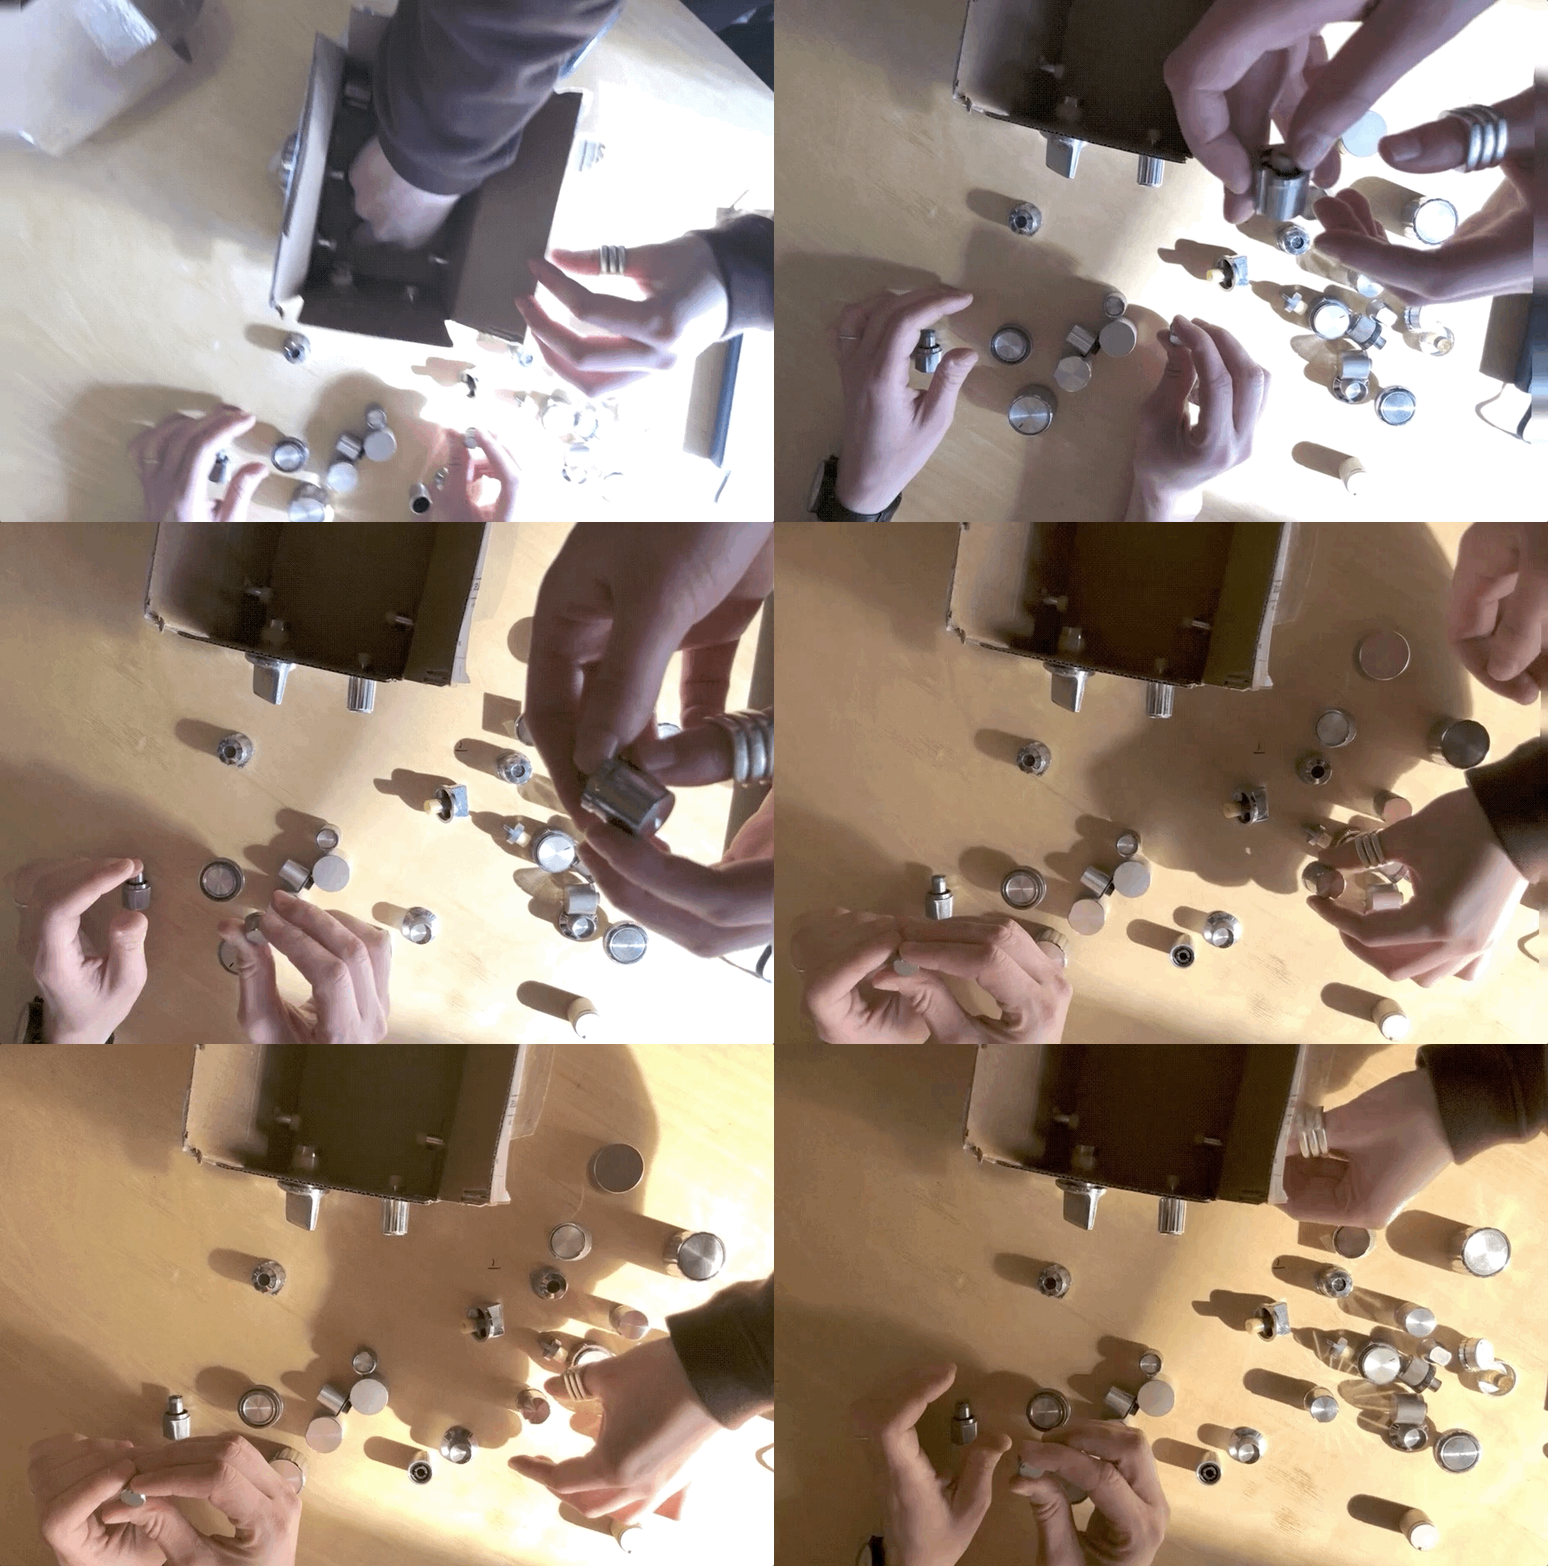
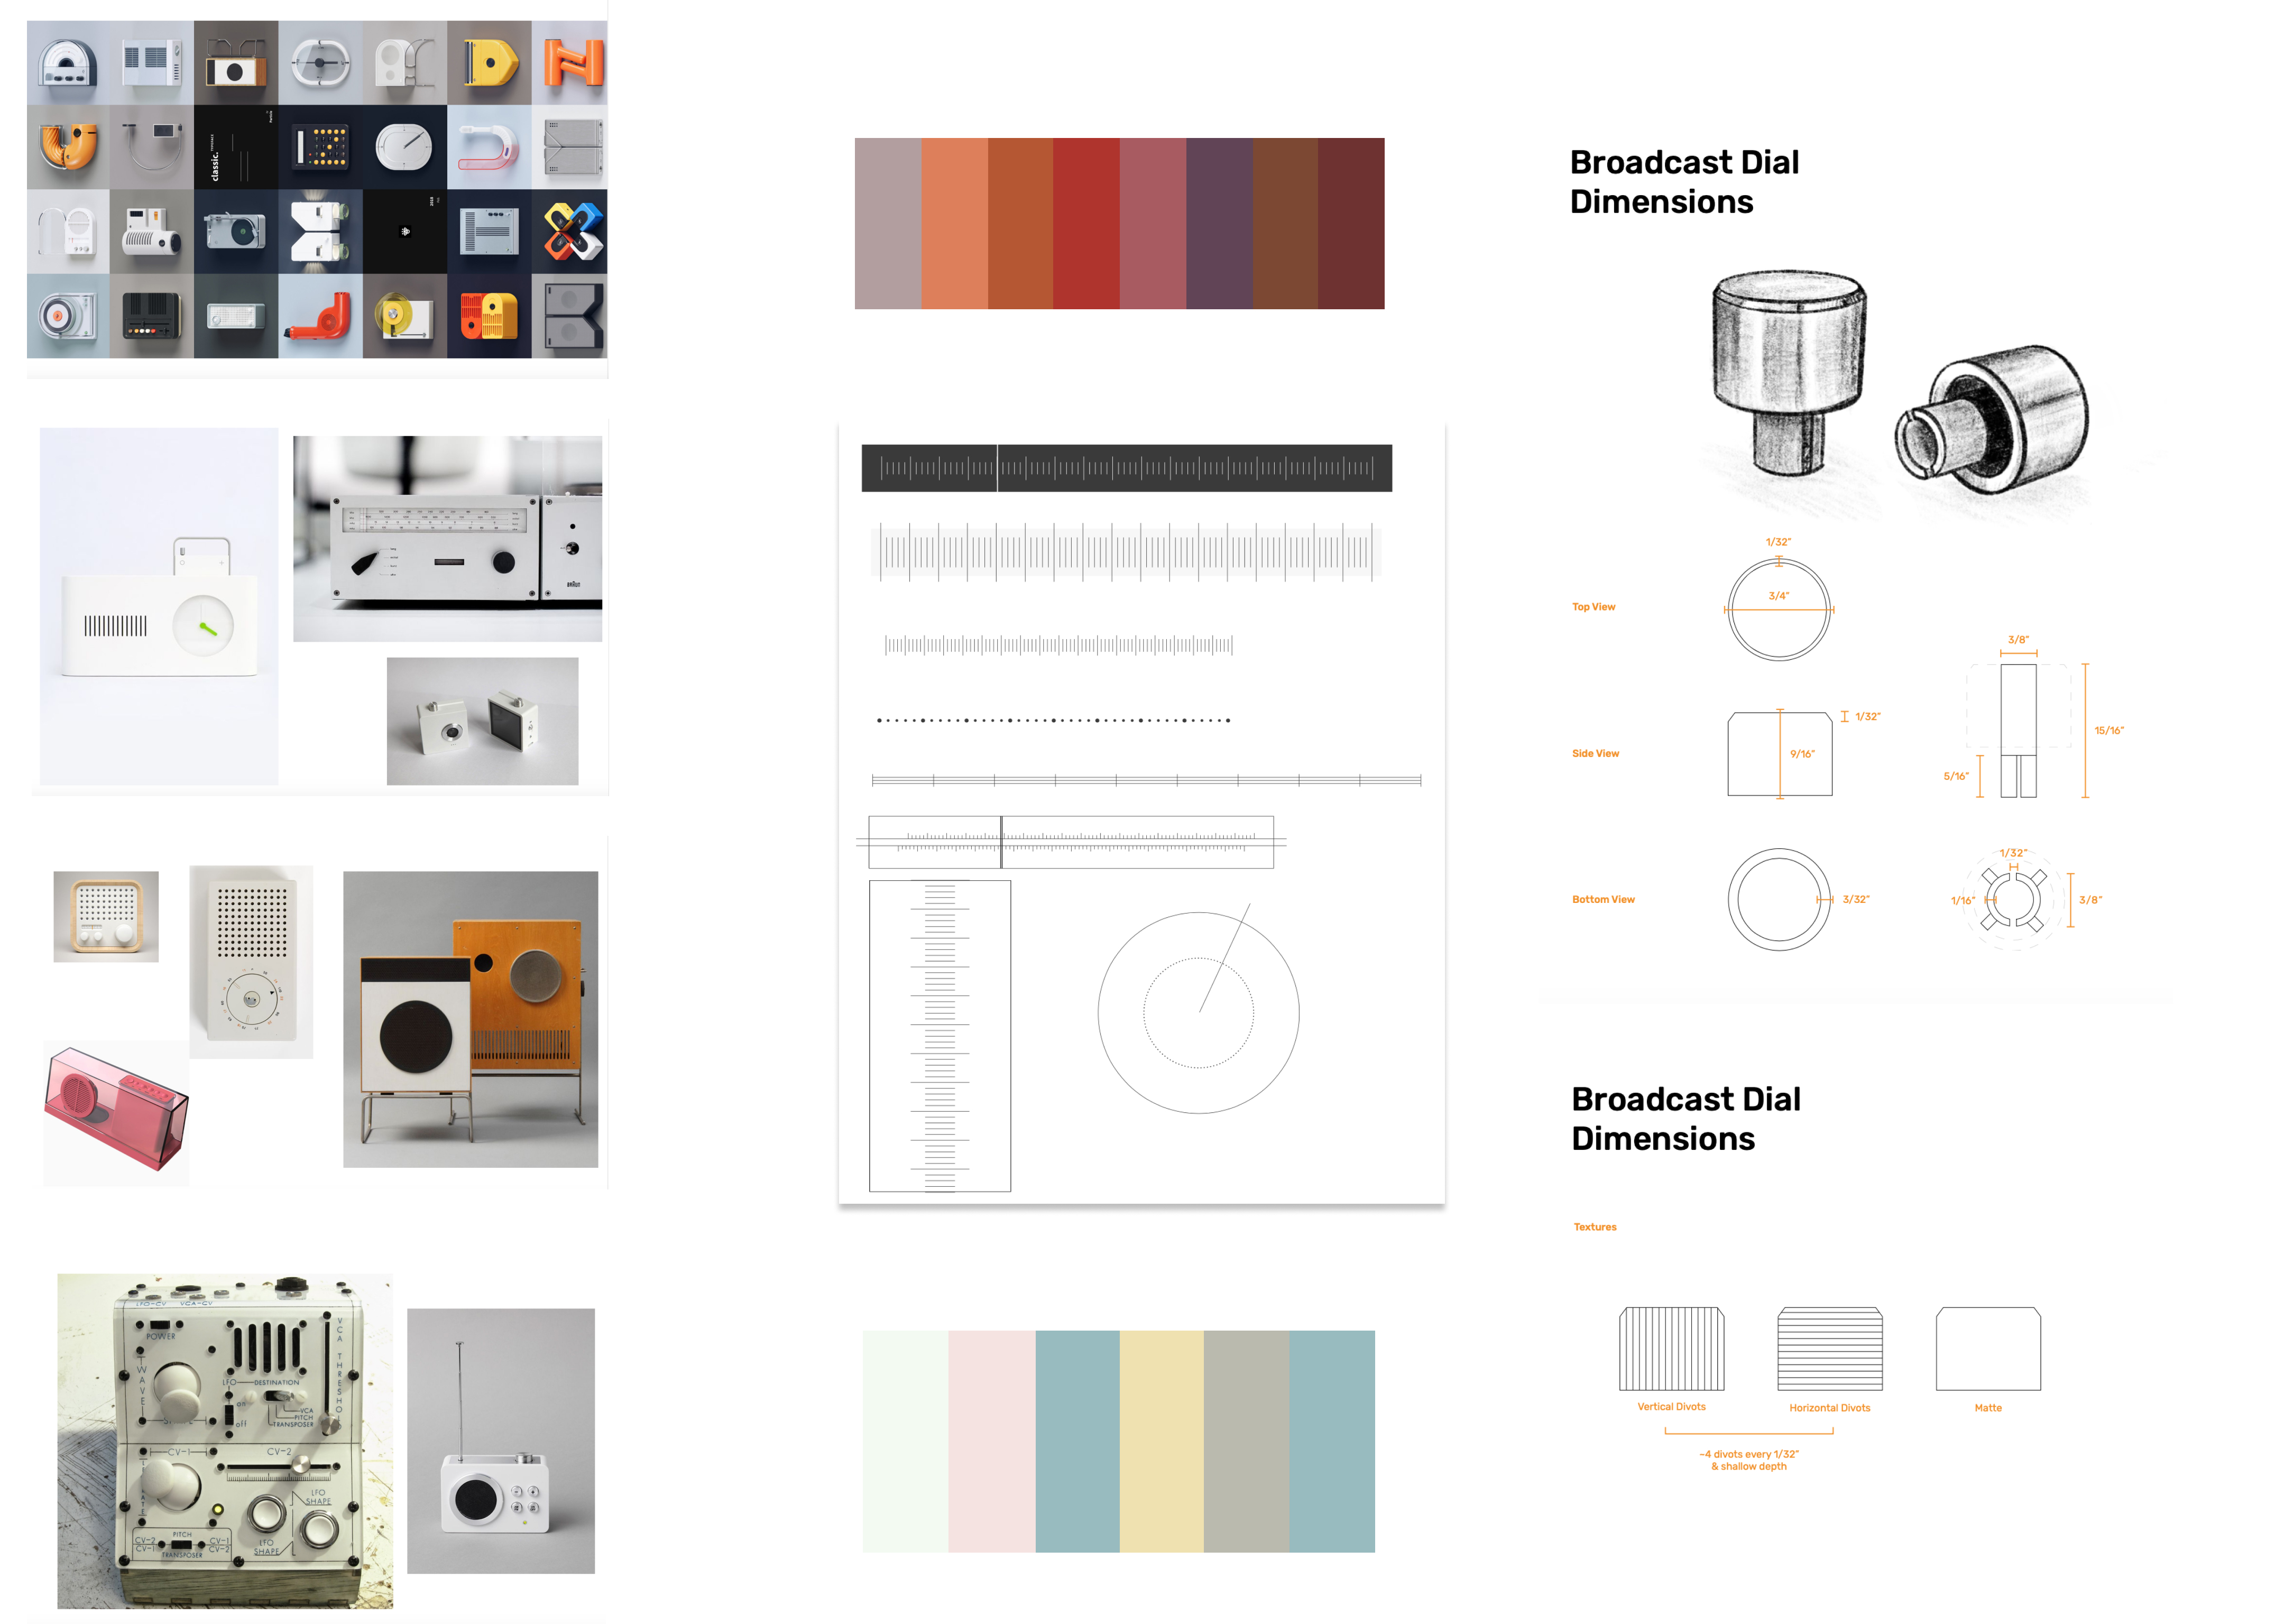
We initially ideated around the form and interface of Broadcast resembling a radio that can tune into data sounds with a dial.
Make Data Tangible
Reflection through making
To translate data into tangible forms pushed us to further reflect on the intention behind it, situated in a home environment, as well as working with different technical constraints.
Broadcast is a provocative prototype, embodying a form and interaction that is disconnected from everyday objects.
Form Design Iteration
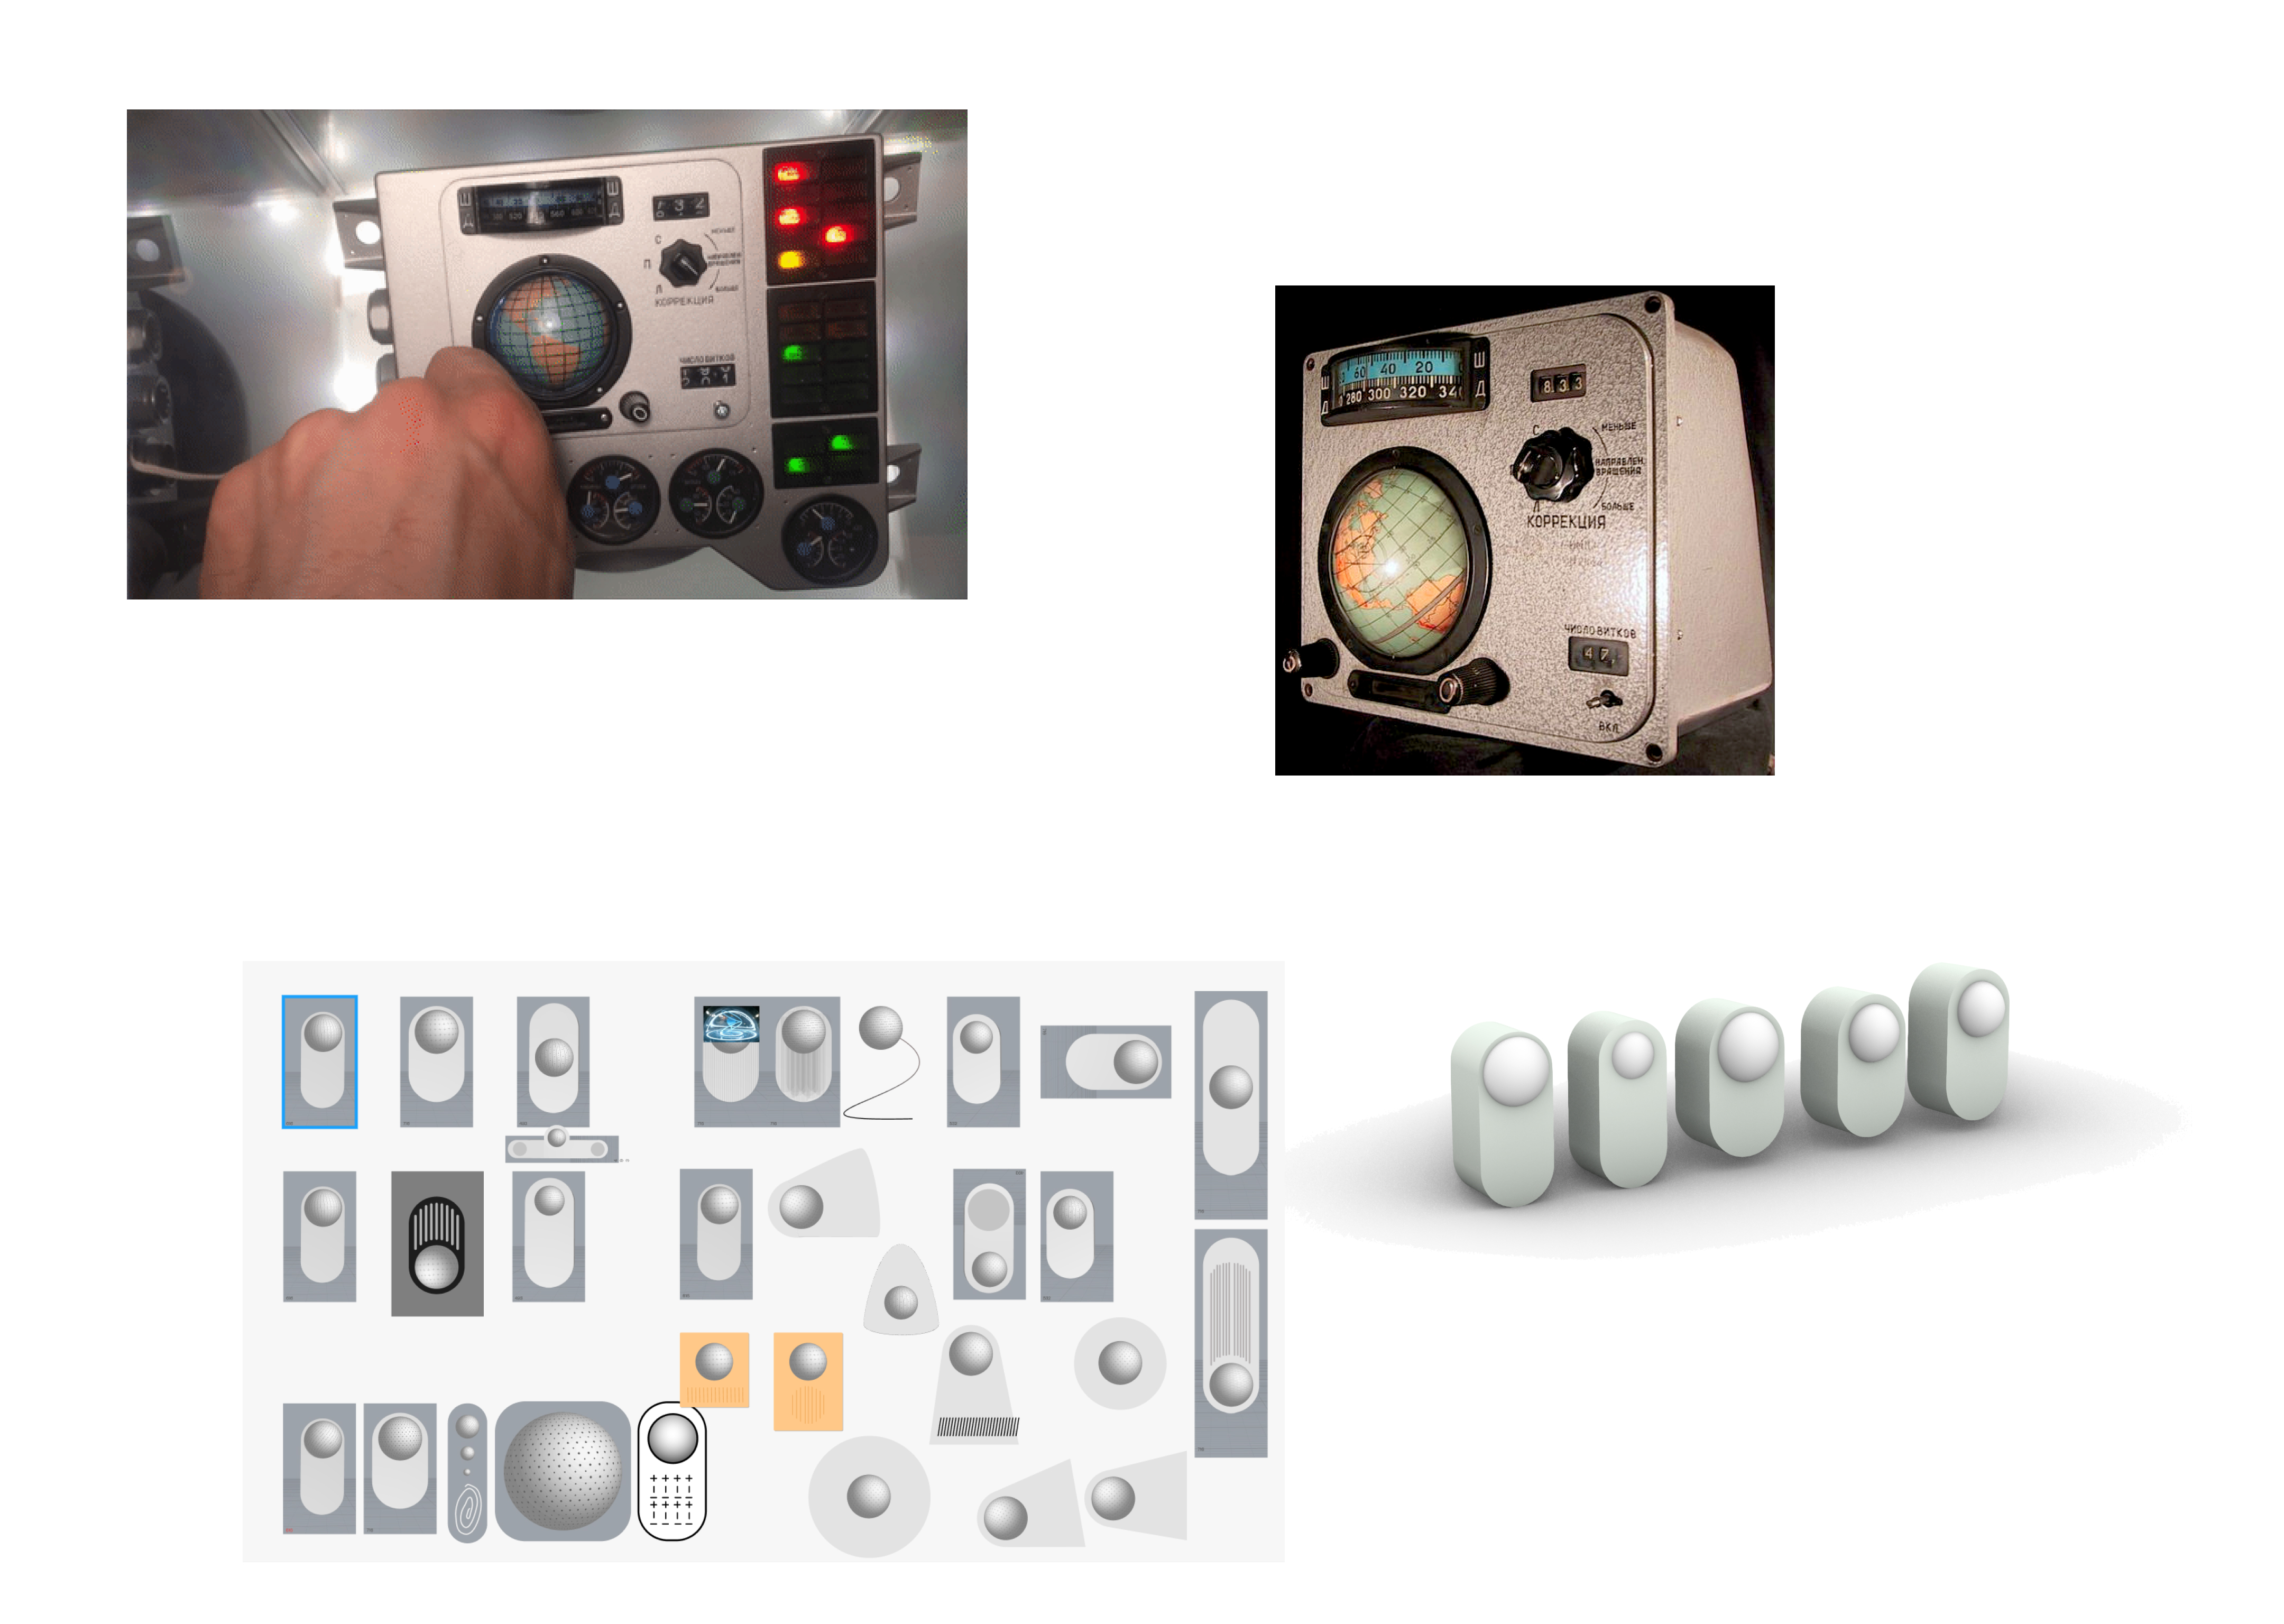
The research adopted new ways of collaboration to the stay-at-home order from COVID-19. Ruby and I had clearer division in Broadcast design. Ruby led the form design and sound of Broadcast, and proposed a new way of interaction that assembled the Spacecraft monitor in Russian.
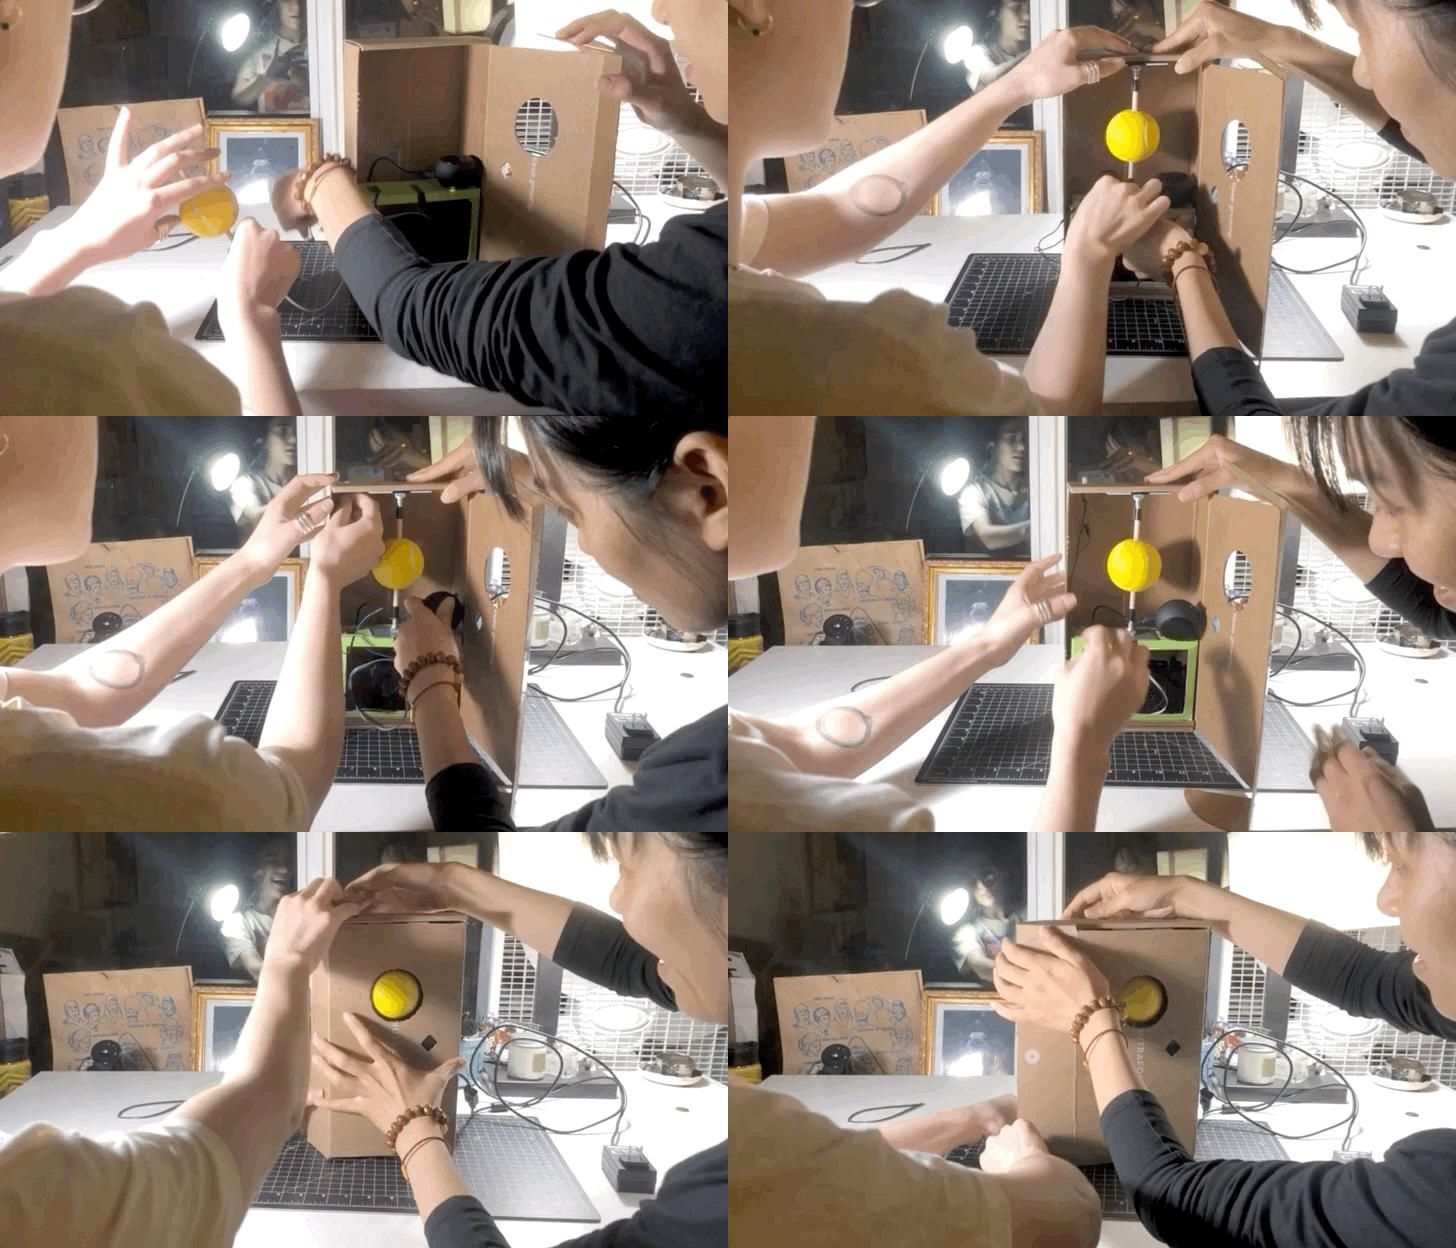 We prototoyped a working prototype to pilot at our homes as researchers
Interaction Design
Partnering with an engineer, I led the interaction design and prototype of Broadcast. Together we define solutions for data storage, home Wi-Fi connectivity, and technical execution.
Partnering with an engineer, I led the interaction design and prototype of Broadcast. Together we define solutions for data storage, home Wi-Fi connectivity, and technical execution.
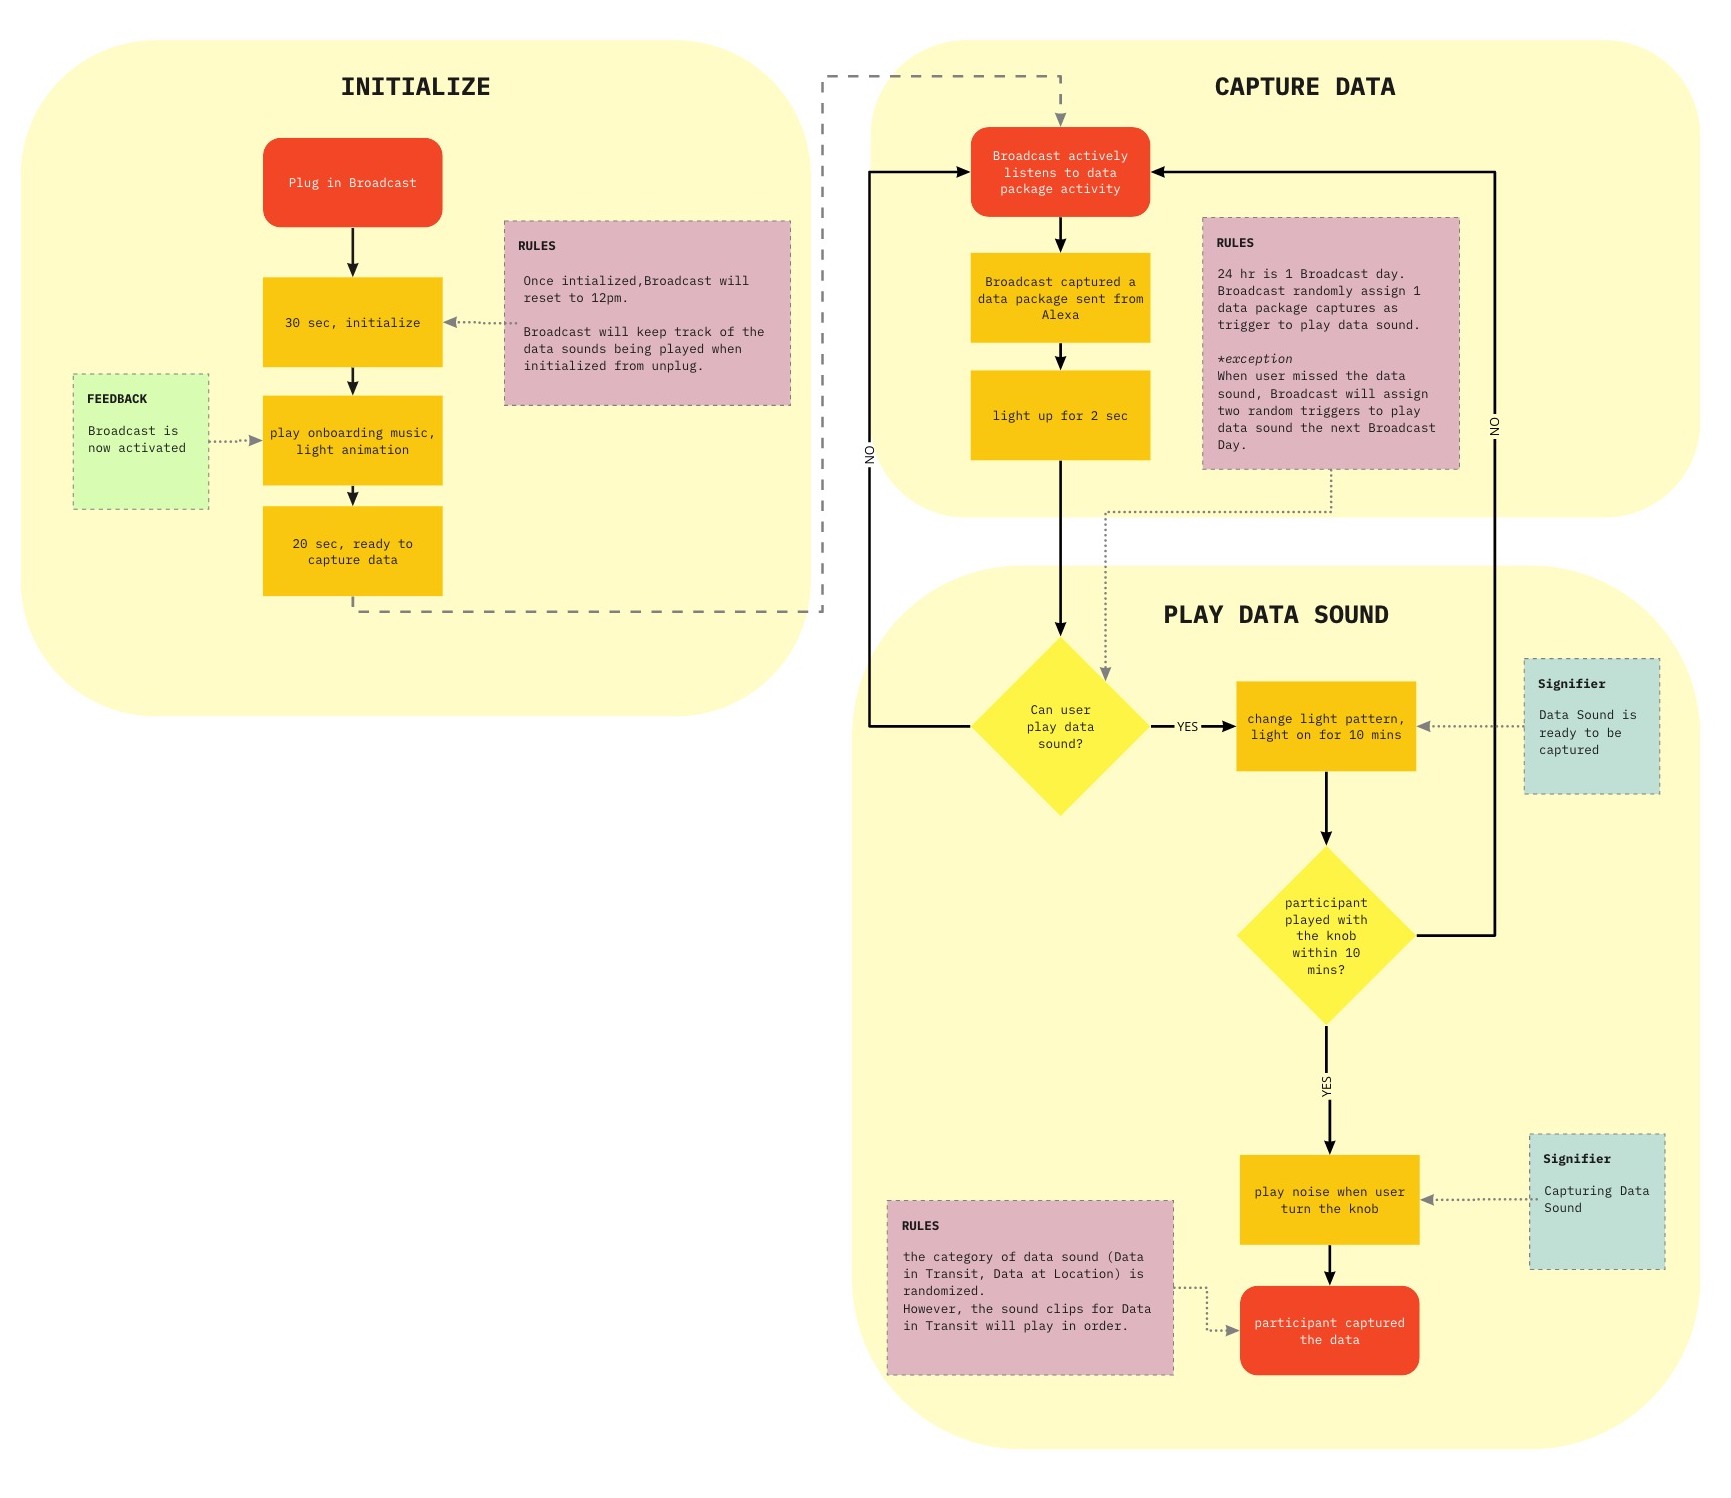
I designed an interaction flow with design theories such as signifiers and feedback of affordance. This helps my communication with the engineer, and to clarify how to translate interaction into code.
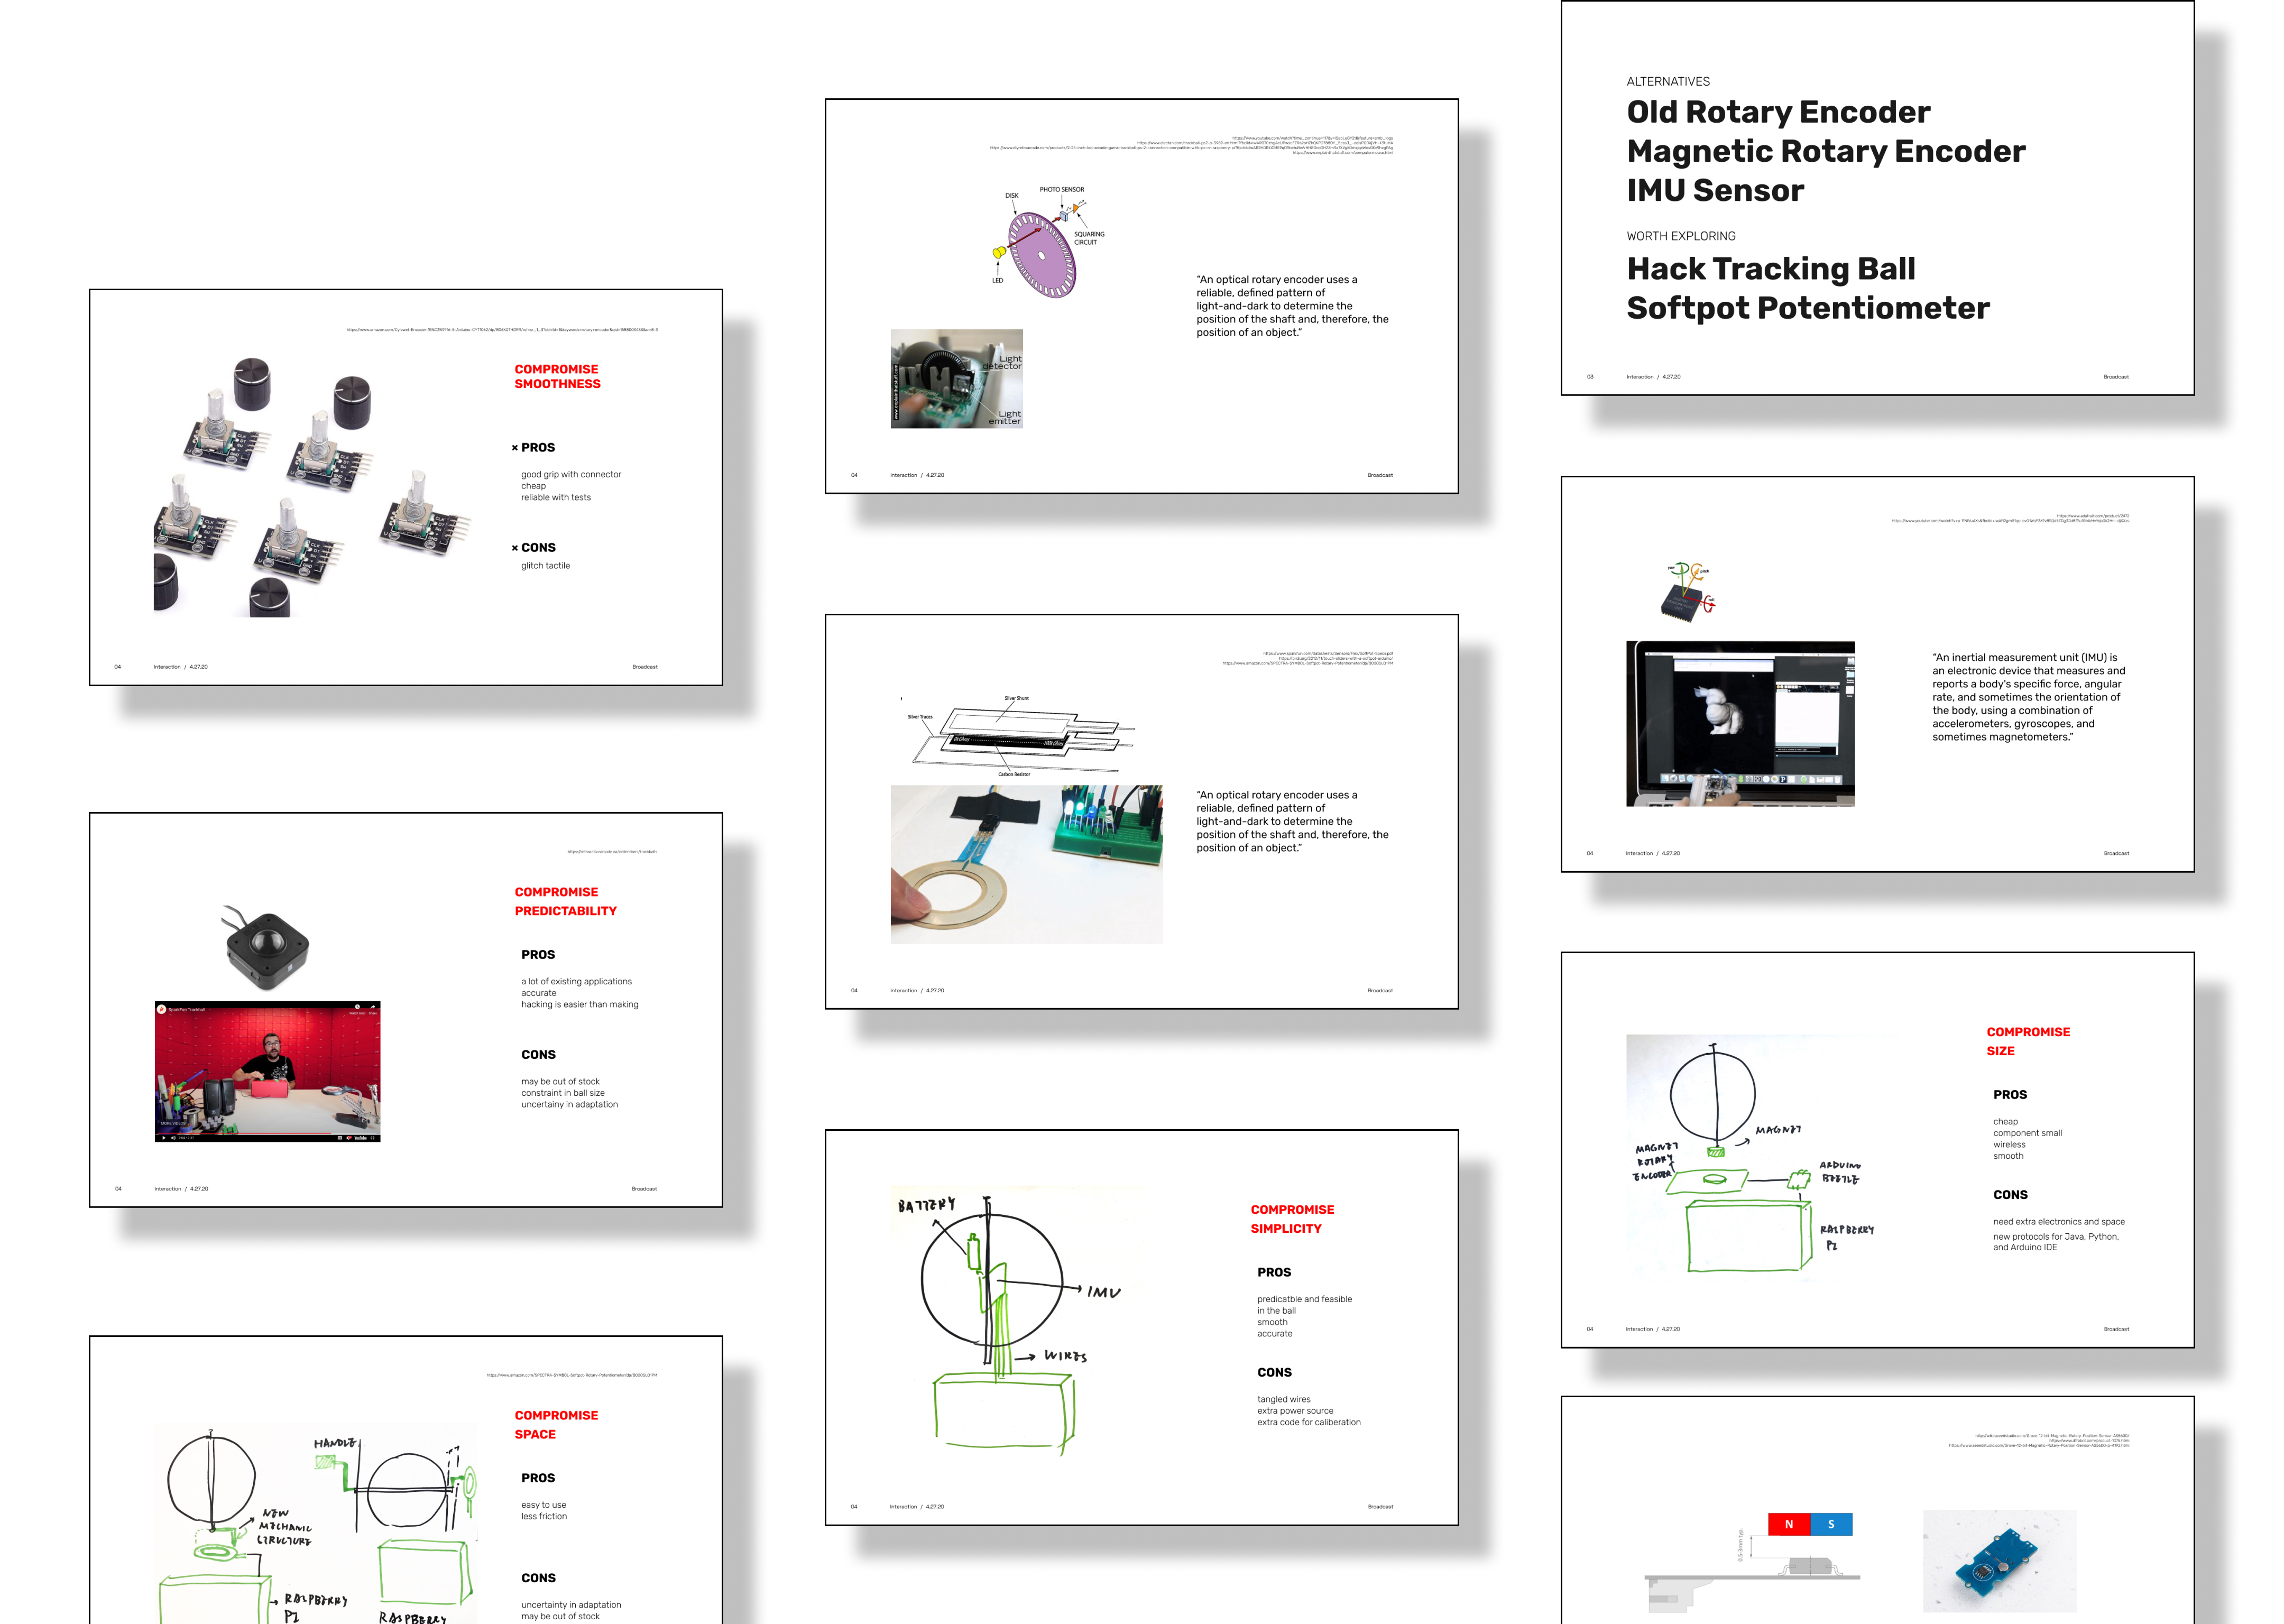
As Broadcast evolved with a new user interaction design to capture sound, I worked with the engineer to explore different technical solutions to make the interaction possible.
Tune in Data’s Travel
